
Enter a balanced crossed measurement study to estimate Gage R&R variation, operator effects, part variation, and optional tolerance use.
Advanced options
Calculation details
| Source | Variance |
|---|
| Source | SS | df | MS | F | p |
|---|
Table of contents
How to use our Gage R&R ANOVA and Measurement System Analysis Calculator
- Enter the Study unit exactly as shown on the gage, drawing, or study sheet, such as mm or psi.
- Check the Study measurements rows. Each operator must measure every same part, with the same number of trials for each part and operator pair.
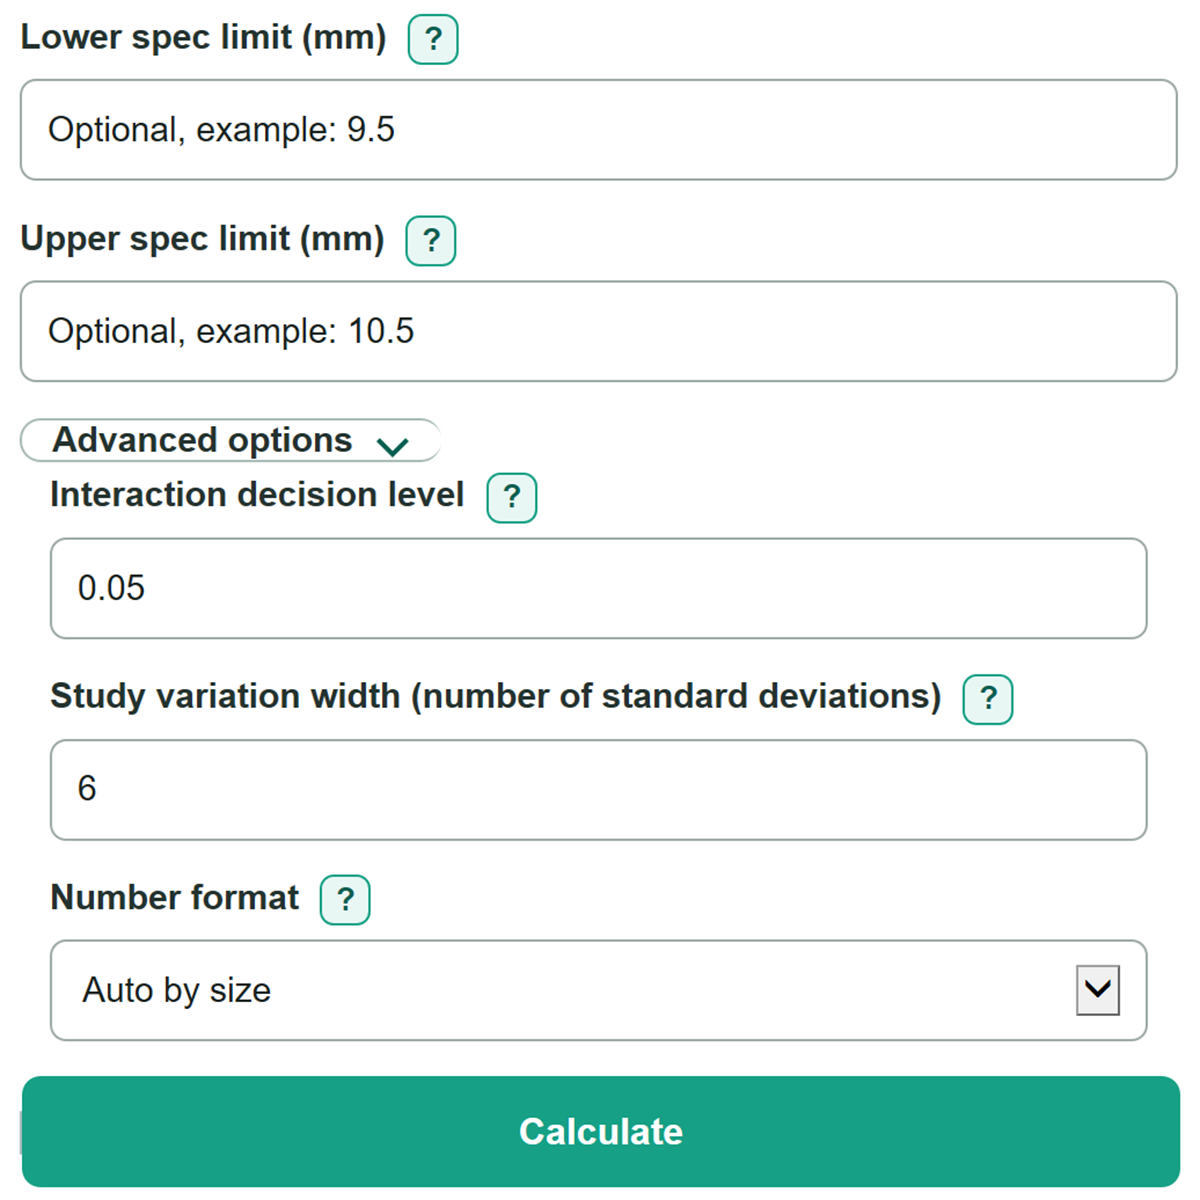
- Enter both Lower spec limit (same unit as readings) and Upper spec limit (same unit as readings), or leave both blank to skip tolerance analysis.
- Open Advanced options only if your procedure specifies a different Interaction decision level, Study variation width (number of standard deviations), or Number format, then select Calculate.
- Sanity-check that the displayed unit matches the source data, that the model treatment makes sense for the interaction p-value, and that percent of tolerance appears only when both drawing limits were entered.
Definitions
Gage R&R: Estimated measurement-system variation. It combines equipment repeatability and operator reproducibility.
Repeatability: Variation when the same operator repeatedly measures the same part under the study conditions.
Reproducibility: Variation associated with different operators, including retained part-by-operator interaction in this calculator.
Part-to-part variation: Estimated real measurement differences among the parts included in the study.
Balanced crossed study: A study where every operator measures every same part the same number of times. This calculator requires at least two parts, two operators, and two trials per part-operator pair.
Part-by-operator interaction p-value: A test result used with the Interaction decision level to decide whether interaction stays separate or is pooled with repeatability.
Study variation: An estimated standard deviation multiplied by the selected Study variation width (number of standard deviations), usually 6.
Number of distinct categories: An estimate of how many part groups the measurement system can separate, calculated with 1.41 times part-to-part standard deviation divided by total Gage R&R standard deviation. [2]
Common mistakes and quick fixes
Mistake: Mixing inch readings with mm limits under Study unit.
Fix: Convert all source values first, then enter one shared unit and use it for every Study measurements row and limit.
Mistake: Giving one operator fewer trials in Study measurements.
Fix: Add or remove rows so every part and operator pair has the same number of unique trial labels.
Mistake: Entering only a Lower spec limit (same unit as readings).
Fix: Enter both limits or clear both fields; percent of tolerance needs a complete tolerance range.
Mistake: Reversing the two specification limits.
Fix: Make Upper spec limit (same unit as readings) greater than Lower spec limit (same unit as readings).
Mistake: Treating Total Gage R&R as percent of study variation and Total Gage R&R as percent of tolerance as the same test.
Fix: Use percent of study variation to compare measurement variation with variation in these parts, and percent of tolerance to compare it with the drawing range.
Mistake: Using a crossed study for parts that are destroyed during testing.
Fix: Do not use these Study measurements for a crossed analysis unless every operator measured the same physical parts; use a suitable nested study design instead.
Limitations & Key Assumptions / Boundary Conditions
- This calculator is only for numeric, balanced crossed studies where every operator measures the same physical parts. It is not for pass-fail results, visual ratings, destructive testing, or nested designs.
- The estimates describe the operators, equipment, parts, fixtures, environment, and measurement procedure represented in the entered study. A changed setup can produce different results.
- Percent of study variation depends on how different the included parts are. A narrow part range can make measurement variation look like a larger percentage.
- Percent of tolerance is calculated only when both specification limits are entered in the same Study unit as the readings. It does not change the ANOVA variance estimates.
- Negative method-of-moments variance estimates are set to zero. This is a calculation boundary, not proof that the real source of variation is exactly zero.
- The common guideline category is a screening aid. Customer requirements, product risk, and internal quality procedures can require a different decision.
Methodology
Balanced crossed ANOVA
The calculator groups each numeric observation by part, operator, and trial. It first checks that every part-operator pair has the same number of trials and that trial labels are unique within that pair. It then separates variation into part, operator, part-by-operator interaction, and repeatability error. This follows the usual purpose of a Gage R&R study: separating measurement variation from variation among parts. [1]
part_ss = operators * trials * sum((part_mean - grand_mean)^2)
operator_ss = parts * trials * sum((operator_mean - grand_mean)^2)
interaction_ss = trials * sum((cell_mean - part_mean - operator_mean + grand_mean)^2)
repeatability_ss = sum((measurement - cell_mean)^2)
Interaction treatment
The calculator compares the part-by-operator interaction p-value with the Interaction decision level. If the p-value is at or below that level, interaction remains a separate variance component. If it is larger, interaction is pooled with repeatability error. Negative variance-component estimates from the ANOVA method are reported as zero.
study_variation = sigma_multiplier * sqrt(estimated_variance)
total_gage_rr_percent_study = 100 * sqrt(total_gage_rr_variance) / sqrt(total_variance)
number_distinct_categories = floor(1.41 * sqrt(part_variance) / sqrt(total_gage_rr_variance))
Tolerance comparison
When both specification limits are present, full tolerance is their difference. The calculator divides total Gage R&R study variation by that positive width and multiplies by 100.
full_tolerance = upper_spec_limit - lower_spec_limit
percent_tolerance = 100 * total_gage_rr_study_variation / full_tolerance
Mini-example: if the estimated total Gage R&R study variation is 8.49 mm and the limits are 0 mm and 30 mm, full tolerance is 30 mm and percent of tolerance is about 28.3%.
Interpretation boundaries
The common guideline category uses total Gage R&R as percent of study variation: 10% or less, over 10% through 30%, and over 30%. These are common screening bands, not automatic approval rules. [2]