
Enter a signed dimension loop to calculate worst-case, RSS, and Monte Carlo assembly ranges in inches or millimeters.
Advanced options
Normal rows use the selected sigma coverage. Uniform rows use their full entered limits. The seed makes the trial sequence repeatable.
Calculation details
Table of contents
How to use our Tolerance Stack-Up Worst-Case, RSS and Monte Carlo Calculator
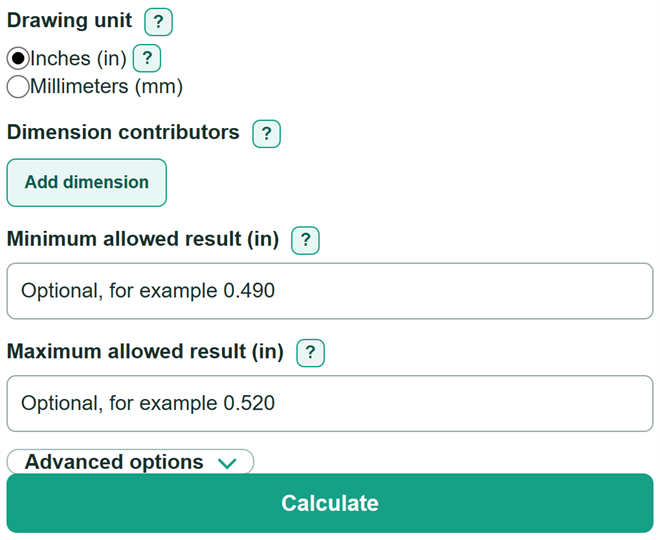
- Choose the Drawing unit printed on the drawing before entering dimensions.
- Add one Dimension contributors row for each part of the functional loop, then choose Adds or Subtracts based on how that dimension changes the final result.
- Copy each nominal dimension, upper tolerance, and lower tolerance as positive magnitudes; use separate values when the drawing has an asymmetric tolerance.
- Enter Minimum allowed result, Maximum allowed result, or both if the assembly has functional limits, then click Calculate.
- Check that the worst-case range stays inside the limits; then use the RSS and Monte Carlo values as statistical estimates only if their distribution and independence assumptions fit the design.
Definitions
Dimension contributors: The dimensions in a one-dimensional functional loop. Each one adds to or subtracts from the final result.
Nominal functional result: The signed total when every contributor is at its drawing nominal.
Worst-case range: The smallest and largest possible result when every contributor is placed at the drawing limit that makes the stack smaller or larger.
RSS: Root-sum-square, a statistical way to combine independent contributor spreads rather than assuming every contributor reaches its worst limit at once.
Tolerance coverage (sigma): The number of standard deviations represented by an entered Normal-row tolerance for the RSS and Monte Carlo assumptions.
Monte Carlo trials: Repeated seeded random samples of the contributor rows used to estimate the stack distribution.
5th and 95th percentiles: Values with about 5% of simulated results at or below the first value and about 95% at or below the second.
Worst-case margin: The distance between a worst-case result and its matching functional limit. A negative margin means the worst-case range crosses that limit.
Common mistakes and quick fixes
Mistake: Entering a negative number in a Dimension contributors nominal cell to mean subtraction.
Fix: Enter the drawing nominal as a nonnegative value and choose Subtracts for that row.
Mistake: Combining an asymmetric drawing callout into one average tolerance in Dimension contributors.
Fix: Copy the positive amount into upper tolerance and the negative-side magnitude into lower tolerance.
Mistake: Entering mm values while Drawing unit is set to inches, or the reverse.
Fix: Set Drawing unit to match the drawing before entry. Changing the unit converts current values; it does not merely relabel them.
Mistake: Treating the RSS minimum estimate or Estimated simulated results within limits as a guaranteed assembly limit.
Fix: Use Worst-case minimum result and Worst-case maximum result for all-limit stacking; use RSS and Monte Carlo only with defensible process assumptions.
Mistake: Leaving Minimum allowed result and Maximum allowed result blank, then assuming the stack passes.
Fix: Add the applicable functional limit to calculate the matching worst-case margin and simulated in-limit percentage.
Mistake: Using too few Monte Carlo trials for a decision near a functional limit.
Fix: Keep Monte Carlo trials at 1,000 or more, and rerun with a larger count or another Repeatable random seed when the estimated rate is close to the decision boundary.
Limitations & Key Assumptions / Boundary Conditions
- This calculator handles a one-dimensional signed dimension chain. It does not model geometric tolerances, datum shift, material condition modifiers, assembly sequence, thermal growth, deformation, or measurement error.
- Worst-case results assume all contributors can reach their limit at the same time. That is useful for a conservative check, but it can be more restrictive than likely production behavior.
- RSS results assume contributors are independent. Correlated dimensions, shared tooling, matching operations, or a common temperature can make the actual spread different.
- For Normal rows, the entered upper and lower tolerances are treated as the selected sigma coverage from nominal, then samples outside the drawing limits are rejected. Uniform rows are sampled evenly between their entered limits.
- Monte Carlo in-limit percentage is a model prediction from entered tolerances, distributions, trial count, and seed. It is not measured yield, Cpk, Ppk, or a production approval.
- Functional limits are optional. Without a Minimum allowed result or Maximum allowed result, the calculator can show stack ranges but cannot determine whether the assembly meets its function.
- Changing Drawing unit converts entered lengths using 25.4 mm per inch. Review imported or copied values if the source drawing contains mixed units.
Methodology
Signed loop calculation
Each contributor has a direction. An Adds row contributes its nominal dimension to the stack. A Subtracts row contributes the negative of its nominal dimension. This keeps direction separate from the number copied from the drawing.
nominal stack = sum of signed nominal dimensions
For an Adds row, its low contribution is nominal minus lower tolerance and its high contribution is nominal plus upper tolerance. For a Subtracts row, those effects reverse because the row is subtracted.
worst-case minimum = sum of each signed low contribution
worst-case maximum = sum of each signed high contribution
RSS estimate
The calculator treats the selected tolerance coverage as the number of standard deviations from nominal for Normal rows. It combines lower-side and upper-side spreads separately, so asymmetric tolerances remain asymmetric. RSS is appropriate only when the contributor variations can reasonably be treated as independent. [2]
RSS lower spread = coverage sigma * sqrt(sum of squared lower-side standard spreads)
RSS upper spread = coverage sigma * sqrt(sum of squared upper-side standard spreads)
RSS minimum = nominal stack - RSS lower spread; RSS maximum = nominal stack + RSS upper spread
Monte Carlo estimate
For every seeded trial, each Uniform row is sampled between nominal minus lower tolerance and nominal plus upper tolerance. Each Normal row uses separate lower and upper spreads, rejects samples outside its drawing limits, and then applies its Adds or Subtracts direction. The calculator sorts all trial results to find the 5th and 95th percentiles. If one or both functional limits are entered, it counts trials that meet every entered limit. Monte Carlo propagation is a general method for evaluating uncertainty through repeated sampling. [3]
in-spec percent = 100 * passing trials / total trials
Worked example
Suppose A adds 2.000 with +0.010/-0.005 and B subtracts 1.500 with +0.004/-0.006. The nominal stack is 2.000 - 1.500 = 0.500. Its worst-case minimum is 1.995 - 1.504 = 0.491, and its worst-case maximum is 2.010 - 1.494 = 0.516. If the allowed range is 0.490 to 0.520, the worst-case margins are 0.001 above the minimum and 0.004 below the maximum.
Unit conversion
Switching Drawing unit converts every contributor and functional limit using the exact relationship of 25.4 millimeters per inch. [1]
millimeters = inches * 25.4
Calculation choices
Functional margins are calculated only for limits entered by the user. Negative margins remain negative because they show the amount by which a worst-case result misses a requirement. A zero-tolerance row has no variation, so its worst-case, RSS, and simulated contributions are all its nominal signed value.