
Use this calculator to find a survey's plus-or-minus range, confidence interval, or sample size needed for a percent or an average.
Advanced options
How to use our Margin of Error Calculator
- Choose What are you measuring? as Survey percent for a yes/no share or Average value for a mean like a score or height.
- Choose What do you want to find? and enter the visible fields, such as Sample size (responses), Expected or observed percent (%), Standard deviation, or a target margin of error.
- Pick Confidence level (%). If you know your full group is limited and you sampled from it without replacement, open Advanced options and turn on Use population size correction?.
- Click Calculate, then read Margin of error first, Confidence interval next, and Sample size needed if you are planning a study.
- Sanity-check the result: a bigger Sample size (responses) should usually make Margin of error smaller, and higher Confidence level (%) should usually make it larger.
Definitions
Margin of error: The plus-or-minus amount around your sample result. Smaller means more precise.
Confidence interval: The range made by taking the sample result and adding and subtracting the margin of error. The margin of error is the half-width of this interval [3].
Confidence level (%): How confident you want the method to be in the long run, such as 90%, 95%, or 99%.
Expected or observed percent (%): In Survey percent mode, the share with the answer or trait of interest. Enter it as a percent from 0 to 100.
Standard deviation: In Average value mode, a measure of spread. Bigger spread means a bigger margin of error if sample size stays the same.
Standard error: The estimated sample-to-sample variation used inside the calculation. It combines spread and sample size.
Critical value: The z number tied to the chosen confidence level. Higher confidence uses a larger value and usually gives a wider margin of error.
Population size correction factor: A multiplier used when you sample a noticeable share of a known, limited population without replacement. It is below 1 when applied, so it reduces the margin of error.
Common mistakes and quick fixes
Mistake: Entering 0.50 in Expected or observed percent (%) when the label asks for a percent.
Fix: Enter 50 for 50%, not 0.50.
Mistake: Using Standard deviation in Survey percent mode, or using Expected or observed percent (%) in Average value mode.
Fix: Match the input to What are you measuring? : percents use Expected or observed percent (%) ; averages use Standard deviation .
Mistake: Typing a blank or zero into Target margin of error (%) or Target margin of error (same units as your average) .
Fix: Enter a value greater than 0, such as 5 for a poll or 2 for an average.
Mistake: Turning on Use population size correction? but entering a Population size (people or items) smaller than the sample.
Fix: Make sure population size is at least as large as Sample size (responses) .
Mistake: Reading Margin of error in Survey percent mode as a percent change instead of percentage points.
Fix: If the sample result is 42% and the margin of error is 5%, read it as 42% plus or minus 5 percentage points, not 5% of 42.
Mistake: Choosing Nearest whole number for Sample size rounding when planning a study and then missing the goal.
Fix: Use Round up so your final Sample size needed meets or beats the target precision.
Limitations & Key Assumptions / Boundary Conditions
- These results use standard normal-based formulas for a simple random sample. Real surveys can differ if sampling is clustered, weighted, stratified, or nonrandom.
- In Survey percent mode, the method is least reliable for very small samples or for percents near 0% or 100%.
- If the true survey percent is unknown, using 50% is a cautious planning choice because it gives the widest margin of error for a given sample size.
- Population size correction should be used only when sampling without replacement from a known, limited population. It should not be used for an unknown or effectively huge population.
- In Average value mode, the result depends on the Standard deviation you enter. If that estimate is poor, the margin of error or sample size estimate can be off.
- Sample size outputs are planning estimates. In practice, response problems, missing data, and survey design choices can mean you need more observations than the formula suggests.
- When sample size is rounded, real-world planning usually should round up, not down.
Methodology
How the calculator works
It uses the selected Confidence level (%) to choose a z critical value: 1.645 for 90%, 1.96 for 95%, and 2.576 for 99%.
Survey percent mode
First convert Expected or observed percent (%) to a decimal proportion. For example, 50% becomes 0.50.
MOE = z * sqrt(p * (1 - p) / n)
Here, p is the proportion as a decimal and n is Sample size (responses).
Confidence interval = sample percent +/- MOE
If population correction is turned on, the calculator applies this extra factor.
FPC factor = sqrt((N - n) / (N - 1))
MOE with correction = MOE * FPC factor
Here, N is Population size (people or items).
For planning sample size in Survey percent mode, the calculator starts with the uncorrected estimate and then optionally adjusts for a finite population.
n0 = z^2 * p * (1 - p) / MOE^2
n = (N * n0) / (N + n0 - 1)
Average value mode
For averages, the calculator uses the entered Standard deviation as the spread estimate.
MOE = z * sigma / sqrt(n)
Confidence interval = sample average +/- MOE
If population correction is turned on, it uses the same correction factor as above.
MOE with correction = z * sigma / sqrt(n) * sqrt((N - n) / (N - 1))
For sample size planning in Average value mode:
n0 = (z * sigma / MOE)^2
n = (N * n0) / (N + n0 - 1)
Mini example
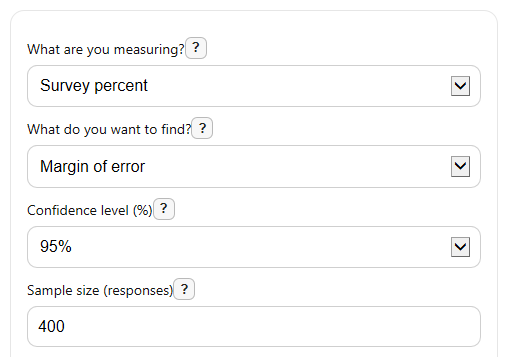
Suppose you choose Survey percent mode, 95% confidence, Sample size (responses) of 400, and Expected or observed percent (%) of 50. Convert 50% to 0.50, then compute 1.96 * sqrt(0.5 * 0.5 / 400). That gives about 0.049, or 4.9 percentage points, so a sample result of 50% would have a confidence interval of about 45.1% to 54.9%.
Rounding and notes
If a sample size result is not a whole number, the calculator applies your chosen Sample size rounding. Round up is usually safer for planning.
Assumptions used
The formulas are standard approximations for simple random sampling and planning calculations for means and proportions [2]. Results can differ from real survey reports when design effects, weighting, or nonresponse are important.