
Enter a sample standard deviation and number of observations, or data values, to calculate the standard error of the mean.
Advanced options
Table of contents
How to use our Standard Error Calculator
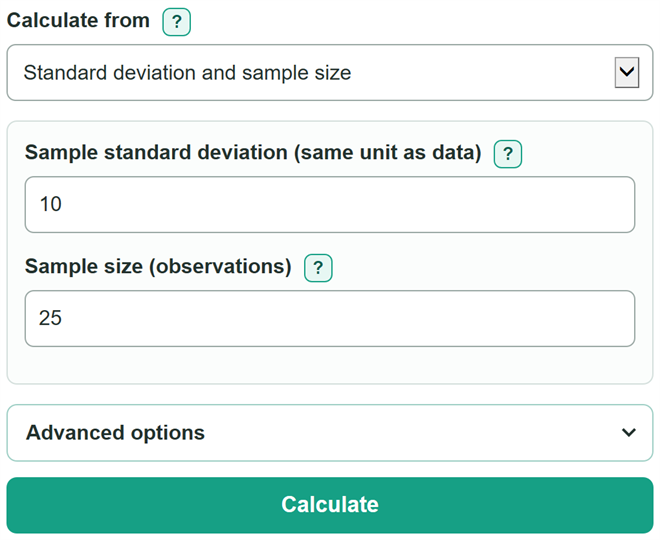
- Under "Calculate from," choose "Standard deviation and sample size" if you already have an SD and n, or choose "Data values" to enter each observation.
- For the summary route, enter the sample standard deviation and a whole sample size of at least 2. For data values, add at least two numbers and choose Sample SD unless your rows are the full population.
- Select "Calculate." The first card shows the standard error of the mean, followed by the standard deviation and number of observations used.
- For a confidence interval, open Advanced options, turn on "Show a confidence interval," choose Student t or Normal z, and choose a confidence level. In the summary route, also enter the sample mean from the same data.
- Check the result before using it: standard error has the same unit as the data, and with the same SD, increasing the sample size should make the standard error smaller.
Definitions
Standard error of the mean (SEM): An estimate of how much sample means would vary across repeated samples. A smaller SEM means the sample mean is more precise.
Standard deviation (SD): A measure of how spread out individual observations are around their mean. SD uses the same unit as the data.
Variance: The square of the standard deviation. Its unit is squared, so it is not interchangeable with SD. [1]
Sample size (n): The number of observations included in the calculation.
Sample SD: SD calculated by dividing squared spread by n - 1. Use it when the entered values are a sample from a larger group.
Population SD: SD calculated by dividing squared spread by n. Use it only when the entered values are the complete population being described.
Confidence interval: A range around the sample mean made by subtracting and adding the margin of error.
Critical value: The selected t or z multiplier used to calculate the margin of error.
Degrees of freedom: For the one-sample Student t method, the sample size minus 1.
Common mistakes and quick fixes
Mistake: Entering variance where the calculator asks for sample standard deviation.
Fix: Check Calculate from and then recalculate. Enter SD, not variance. Variance is SD squared, so it has squared units.
Mistake: Entering a decimal, label, or count below 2 for sample size.
Fix: Check Calculate from and then recalculate. Enter the whole number of observations. It must be at least 2.
Mistake: Choosing Population SD for raw values that are only a sample.
Fix: Check Calculate from and then recalculate. Choose Sample SD unless the rows include every member of the population you want to describe.
Mistake: Leaving a blank row, typing a word, or mixing measurement units in data values.
Fix: Check Calculate from and then recalculate. Put one finite number in each row and make sure every observation uses the same unit.
Mistake: Requesting a confidence interval in summary mode without a sample mean.
Fix: Check Calculate from and then recalculate. Enter the mean from the same sample as the SD and sample size.
Mistake: Using standard error as though it describes the spread of individual observations.
Fix: Check Calculate from and then recalculate. Use standard deviation for individual spread. Use standard error for the precision of the sample mean.
Limitations & Key Assumptions / Boundary Conditions
- This calculator finds the standard error of a mean. It does not calculate the standard error of a proportion, percentage, regression coefficient, or other statistic.
- All observations must describe the same measurement in the same unit. The calculator does not convert units or detect mixed units.
- The usual interpretation of SEM assumes observations are independent and come from a relevant sample. Linked, clustered, biased, or repeated observations can make the value misleading.
- Sample SD and population SD use different divisors. Using Population SD for sample data gives a smaller SD and a smaller standard error.
- A confidence interval depends on the selected confidence level and critical-value method. The calculator does not decide whether Student t or Normal z is appropriate for the study.
- The calculator checks entered numbers, not data quality. It cannot determine whether sampling was random, whether outliers need review, or whether a normal-based interval fits a particular dataset.
Methodology
Standard error calculation
The calculator divides the standard deviation by the square root of the number of observations. SD describes the spread of individual values, while SEM estimates the precision of the sample mean. [2]
SEM = SD / √n
SEM is the standard error of the mean, SD is the entered or calculated standard deviation, and n is the number of observations. SEM has the same unit as the original observations.
Data-values route
For raw data, the calculator finds the arithmetic mean, adds the squared distance of each value from that mean, and calculates variance using the SD basis you selected. SD is the square root of that variance.
mean = total of data values / n
sample variance = total squared distance / (n - 1)
population variance = total squared distance / n
SD = √variance
Confidence interval
When the confidence-interval setting is on, the calculator multiplies SEM by the selected critical value to find the margin of error. Student t uses n - 1 degrees of freedom. Normal z does not use degrees of freedom.
margin of error = critical value * SEM
lower end = mean - margin of error
upper end = mean + margin of error
Worked example
For SD = 10 and n = 25, SEM is 10 / √25 = 2. With a sample mean of 50 and a 95% Student t critical value of about 2.0639 for 24 degrees of freedom, the margin of error is about 4.1278. The interval runs from about 45.8722 to 54.1278.
Calculation boundaries
At least two observations are required. An SD of 0 is valid and produces an SEM of 0. Negative observations and negative confidence-interval endpoints remain valid when they fit the measurement scale. The calculation cannot determine whether the observations are independent, randomly sampled, or suitable for the selected t or z interval method.