
Estimate how many years an EV charging station may need to earn back its net upfront cost.
Advanced options
Project costs
Demand charge check
Table of contents
How to use our EV Charging Station Break-Even Calculator
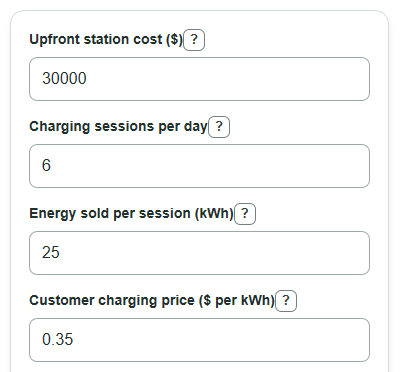
- Enter the basic project numbers: Upfront station cost, Charging sessions per day, Energy sold per session, Customer charging price, and Electricity energy cost.
- Open Advanced options if you want to include Rebates or incentives, Other yearly costs, or a utility Demand charge based on Station power used for demand charge.
- Use Billed peak share to test managed charging or shared-load cases. Enter 100 if the full station peak is billed.
- Click Calculate and read Break-even time after yearly costs first, then check Annual net cash flow after costs to see if the project is actually positive each year.
- Sanity-check the output: if Annual demand charge cost is larger than the yearly energy margin, the break-even time should get much longer or may not be reached.
Definitions
kWh: Kilowatt-hour. This is energy delivered to the vehicle. Energy sold per session uses kWh.
kW: Kilowatt. This is power, or how fast energy can be delivered. Station power used for demand charge uses kW.
Demand charge: A utility fee based on peak power use, usually shown as $ per kW per month, not on total energy sold.
Billed peak share: The percent of station peak power that you expect the utility to bill. A lower percent can represent managed charging or shared site load.
Net upfront cost after rebates: Upfront station cost minus Rebates or incentives. This is the cost the yearly cash flow must recover.
Break-even time after yearly costs: Net upfront cost after rebates divided by Annual net cash flow after costs, shown in years when yearly cash flow is positive.
Simple annual return on net upfront cost: Annual net cash flow after costs divided by Net upfront cost after rebates, shown as a percent per year.
Common mistakes and quick fixes
Mistake: Putting only hardware in Upfront station cost and leaving out installation or permits.
Fix: Use the full one-time project cost before Rebates or incentives.
Mistake: Mixing up Station power used for demand charge with Energy sold per session.
Fix: Enter power in kW for Station power used for demand charge, and enter delivered energy in kWh for Energy sold per session.
Mistake: Entering the full utility bill in Electricity energy cost.
Fix: Use only the $ per kWh energy rate in Electricity energy cost, and put peak-power fees in Demand charge.
Mistake: Setting Billed peak share above 100 or using a guess that hides a real peak charge.
Fix: Keep Billed peak share from 0 to 100 percent. Use 100 if you do not have a clear load-management estimate.
Mistake: Treating Annual charging revenue as profit.
Fix: Compare Annual charging revenue with Annual net cash flow after costs, which subtracts electricity energy cost, demand charge cost, and Other yearly costs.
Mistake: Reading Simple annual return on net upfront cost as a full investment return.
Fix: Use it as a simple first-pass ratio only. It does not include taxes, financing, depreciation, or changing cash flow.
Limitations & Key Assumptions / Boundary Conditions
- The calculator uses a simple payback model. It does not discount future cash flow, so it is not the same as net present value.
- Daily use is treated as a steady average for the whole year. Seasonal travel, workplace schedules, outages, and new competition can change results.
- Customer charging price and Electricity energy cost are treated as flat $ per kWh values. Time-of-use rates, idle fees, session fees, taxes, and revenue sharing are not modeled.
- Demand charge cost uses one entered Station power used for demand charge, one Demand charge, and one Billed peak share. Real utility tariffs can use ratchets, seasonal rates, minimum bills, or separate peak windows.
- Other yearly costs is a single yearly number. The calculator does not split maintenance, network fees, insurance, payment processing, rent, or repairs into separate schedules.
- Financing, loan interest, depreciation, tax credits, resale value, and equipment replacement are outside this simple model.
- If Annual net cash flow after costs is zero or negative and Net upfront cost after rebates is positive, the station does not break even under the entered numbers.
Methodology
Calculation steps
The calculator first estimates yearly energy sold from average daily charging activity, then compares yearly revenue with the yearly costs entered by the user. This is a simple payback approach, a common first-pass way to compare project cost with yearly cash flow [3].
daily_kwh_sold = sessions_per_day * kwh_per_session
annual_kwh_sold = daily_kwh_sold * 365
annual_charging_revenue = annual_kwh_sold * charging_price_per_kwh
annual_electricity_energy_cost = annual_kwh_sold * electricity_cost_per_kwh
annual_demand_charge_cost = station_power_kw * (billed_peak_percent / 100) * demand_charge_per_kw_month * 12
annual_net_cash_flow = annual_charging_revenue - annual_electricity_energy_cost - annual_demand_charge_cost - other_yearly_costs
net_upfront_cost = upfront_cost - rebate_amount
break_even_years = net_upfront_cost / annual_net_cash_flow
simple_roi_percent = (annual_net_cash_flow / net_upfront_cost) * 100
Special cases
If net_upfront_cost is 0 or less, break-even time is shown as 0 years because rebates or incentives cover the entered upfront cost in this simple model. If annual_net_cash_flow is 0 or less while net_upfront_cost is positive, the calculator reports that break-even is not reached instead of dividing by zero. Simple annual return is not shown when net_upfront_cost is 0 or less because that ratio is not meaningful.
Mini example
Suppose Upfront station cost is $30,000, Rebates or incentives are $5,000, Charging sessions per day is 6, Energy sold per session is 25 kWh, Customer charging price is $0.35 per kWh, Electricity energy cost is $0.15 per kWh, Other yearly costs are $2,400, Station power used for demand charge is 50 kW, Demand charge is $12 per kW per month, and Billed peak share is 100 percent. The station sells 6 * 25 * 365 = 54,750 kWh per year. Annual charging revenue is 54,750 * $0.35 = $19,162.50. Annual electricity energy cost is 54,750 * $0.15 = $8,212.50. Annual demand charge cost is 50 * 1.00 * $12 * 12 = $7,200. Annual net cash flow after costs is $19,162.50 - $8,212.50 - $7,200 - $2,400 = $1,350. Net upfront cost after rebates is $25,000, so break-even time is $25,000 / $1,350 = 18.52 years.
Sources
- AFDC (DOE Alternative Fuels Data Center) - Estimating the Breakeven Cost of Delivered Electricity... (hosted PDF) - Energy
- Can public EV fast-charging stations be profitable in the United States? - Mckinsey
- NYSERDA - EV Charging Stations Financing / Economic Viability; simple payback & discounted cash flow concepts (PDF) - NY
- [1705.02116] Electrical Vehicle Charging Station Profit Maximization: Admission, Pricing, and Online Scheduling - Arxiv