
Estimate whether a protein is likely to be less or more soluble under your chosen pH, pI, salt, and temperature conditions.
Advanced options
How to use our Protein Solubility Calculator
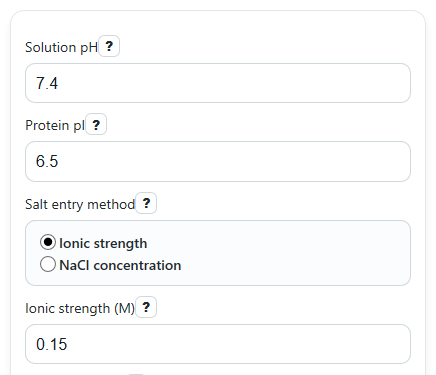
- Enter Solution pH and Protein pI. pI is the pH where the protein has about zero net charge, and proteins are often least soluble near that point.
- Choose Salt entry method, then enter either Ionic strength (M) or NaCl concentration (mM), plus Temperature (C).
- If useful, open Advanced options and add Protein concentration (mg/mL) or Protective additive present for a more tailored estimate.
- Click Calculate, then read Estimated solubility zone first, followed by Relative solubility score and Compared with pH = pI to see whether your chosen pH is better or worse than the lowest-charge zone.
- Sanity-check the result: if Distance from pI is very small, expect lower solubility; if the score changes a lot when you move pH farther from pI, that is normal in this model.
Definitions
Solution pH: The acidity or basicity of the buffer or solution around the protein.
Protein pI: The isoelectric point, or the pH where the protein has about zero net charge. Proteins are often least soluble near this point.
Ionic strength (M): A measure of how much dissolved ion effect is present in the solution. More dissolved salt usually means higher ionic strength.
NaCl concentration (mM): The amount of sodium chloride in millimolar. In this calculator, NaCl is converted to ionic strength using a simple 1:1 salt assumption.
Distance from pI: The absolute difference between Solution pH and Protein pI. Bigger distance usually means the protein carries more net charge and may stay dissolved more easily.
Relative solubility score: A 0 to 100 comparison score. Higher means the chosen conditions are more favorable for staying dissolved than lower-scoring conditions for the same protein.
Compared with pH = pI: The score difference between your chosen setup and the same setup with pH forced to equal pI.
Common mistakes and quick fixes
Mistake: Entering the same value for Solution pH and Protein pI without realizing that puts the protein near its lowest-solubility zone.
Fix: Double-check both labels. If you want to test a more favorable condition, change Solution pH so it is farther from Protein pI .
Mistake: Typing NaCl in mM into Ionic strength (M) , such as entering 150 instead of 0.15.
Fix: Use NaCl concentration (mM) for values like 150, or convert to molar units before using Ionic strength (M) .
Mistake: Forgetting that the hidden salt field is ignored after changing Salt entry method .
Fix: After switching Salt entry method , fill in the visible salt input only and ignore the hidden one.
Mistake: Reading Relative solubility score as if it were percent dissolved or a measured mg/mL solubility.
Fix: Treat Relative solubility score as a comparison score for the same protein under different conditions, not an absolute lab measurement.
Mistake: Leaving Protein concentration (mg/mL) blank in Advanced options but then assuming crowding risk was included.
Fix: Enter Protein concentration (mg/mL) if you want concentration to affect the estimate; otherwise the calculator omits that adjustment.
Mistake: Ignoring Important note when using extreme pH, very high salt, or high Temperature (C) .
Fix: If Important note appears, use the result as a rough screening estimate and confirm with real lab testing.
Limitations & Key Assumptions / Boundary Conditions
- This tool gives a heuristic estimate, not a measured solubility in mg/mL or a percent dissolved value.
- The model assumes pH distance from pI is the main driver and simplifies many protein-specific effects such as sequence, structure, cofactors, and buffer chemistry.
- The salt model is intentionally simple: low to moderate ionic strength may help, while high ionic strength can reduce solubility. Real behavior depends on salt identity and the specific protein.
- The NaCl path assumes a simple 1:1 electrolyte, so NaCl concentration (mM) is treated as approximately equal to ionic strength after conversion to molar units.
- The temperature adjustment is a caution rule, not a thermodynamic prediction. Some proteins remain stable when warm, while others aggregate earlier.
- If you enter very high Protein concentration (mg/mL), the estimate only applies a simple crowding penalty and cannot model full aggregation kinetics.
- Results are weakest at extreme conditions such as very low or very high pH, very high salt, or unusually high temperature.
Methodology
How the estimate is built
The calculator first finds how far the chosen pH is from the protein's isoelectric point. That distance is the main driver because proteins are often least soluble near pI.
delta_pH = abs(pH - pI)
It then builds a starting score from that distance.
base_score = min(100, 20 + 22*delta_pH)
Next it adjusts the score for salt. Low to moderate ionic strength gets a small positive adjustment, while very high ionic strength gets a negative adjustment to reflect salting-out risk [2].
salt_adj = 8 if 0.02 <= I <= 0.20; 0 if I < 0.02 or 0.20 < I <= 0.50; -18 if I > 0.50
If you use NaCl concentration (mM), the calculator converts it to molar units first, then uses that as ionic strength for this simplified NaCl-only path.
I = c_NaCl(M) = c_NaCl(mM)/1000
The calculator then applies a temperature adjustment and, if entered, a concentration adjustment and an additive adjustment.
temp_adj = 4 if T <= 10; 0 if 10 < T <= 25; -8 if 25 < T <= 37; -18 if T > 37
conc_adj = 0 if C <= 1; -6 if 1 < C <= 10; -14 if C > 10
additive_adj = 6 if additive = yes; 0 if additive = none
All parts are added and then limited to a readable 0 to 100 range.
relative_score = clamp(base_score + salt_adj + temp_adj + conc_adj + additive_adj, 0, 100)
The comparison output shows how much better or worse your chosen setup is than the same protein at pH equal to pI, using the same salt, temperature, concentration, and additive settings.
baseline_compare = relative_score - baseline_score(delta_pH=0, same I,T,C,additive)
How the zone label is assigned
The score is converted to a plain-language category so beginners can read it quickly. Lower scores map to least soluble zone or lower solubility, middle scores map to moderate solubility, and higher scores map to more favorable for solubility.
Mini example
Suppose Solution pH is 8.5, Protein pI is 6.5, Ionic strength (M) is 0.15, and Temperature (C) is 25. Then delta_pH is 2.0, base_score is 64, salt adds 8, temperature adds 0, and the final Relative solubility score is 72. With the same side conditions at pH = pI, the baseline score would be 28, so Compared with pH = pI is +44 score points.
Assumptions used
This method is a transparent screening model, not a universal protein-solubility law. It is meant for comparing conditions for the same protein, especially how moving pH away from pI changes the outlook. Real lab results can differ because proteins respond differently to buffer species, exact salts, ligands, redox state, and structural stability [1].