
Enter known concentration and response pairs plus an unknown response to calculate the unknown concentration and check whether it falls within the measured range.
Table of contents
How to use our Calibration Curve Calculator
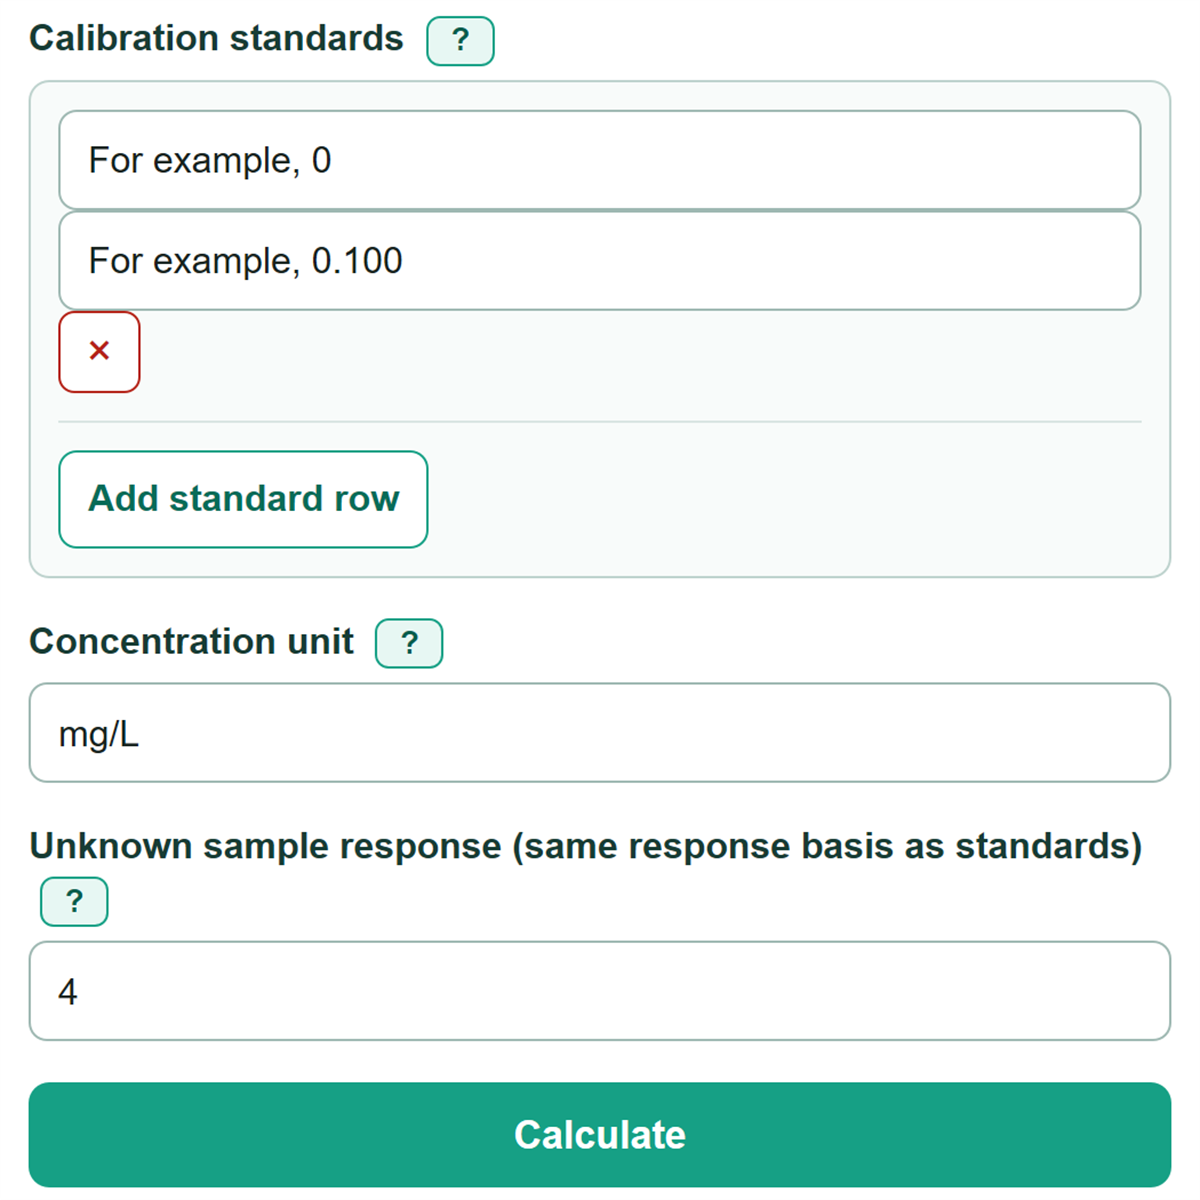
- Enter each known standard concentration and its matching instrument response on the same row. Add at least three complete standards.
- Enter the concentration unit exactly as it appears in your method or standards table, such as mg/L, ppm, or uM.
- Enter the unknown sample response on the same signal basis as the standards, then select "Calculate".
- Read the calculated concentration and its range status. Interpolation means the response is within the measured standard-response range; extrapolation means it is outside it.
- Sanity-check the fitted equation, residuals, and largest absolute residual. A repeating residual pattern or one large residual can mean a straight line is a poor fit even when R-squared is high.
Definitions
Calibration standard: A sample with a known concentration and a measured instrument response.
Concentration: The x value in this calculator. The calculated unknown uses the same unit as the entered standards.
Response: The y value measured by the instrument, such as absorbance, peak area, or signal intensity.
Slope: The fitted change in response for each one-unit increase in concentration.
Y-intercept: The fitted response when concentration is zero. It is calculated from all entered standards and is not forced to zero.
Residual: The measured response minus the response predicted by the fitted line for one standard.
R-squared: A number that describes how much variation in the entered standard responses is represented by the fitted straight line.
Interpolation: Back-calculating an unknown with a response from the smallest through largest entered standard response.
Extrapolation: Back-calculating an unknown with a response outside the measured standard-response range.
Common mistakes and quick fixes
Mistake: Reversing concentration and instrument response.
Fix: Enter known concentration as x and measured instrument response as y in every standard row.
Mistake: Leaving only one cell filled in a standard row.
Fix: Complete both values for that standard or remove the unused row before calculating.
Mistake: Mixing raw responses with blank-corrected or differently processed responses.
Fix: Use the same signal type, instrument settings, blank treatment, and processing for every standard and the unknown.
Mistake: Treating extrapolation as equally supported by the standards.
Fix: When possible, prepare and measure standards that cover the unknown response.
Mistake: Using R-squared alone to accept the line.
Fix: Inspect the signed residuals by concentration. A curved or uneven pattern can matter even when R-squared is high.
Limitations & Key Assumptions / Boundary Conditions
- This calculator fits one straight line by ordinary least squares. Do not use it for a clearly curved, saturated, or otherwise nonlinear calibration range.
- All standard responses and the unknown response must use the same instrument settings, signal type, blank treatment, and processing method.
- Interpolation checks only whether the unknown response is within the entered response range. It does not check sample preparation, matrix effects, or instrument performance.
- An extrapolated result assumes the fitted line continues beyond the entered standards. Add standards in that range before relying on a reported measurement.
- R-squared and residuals describe the entered data fit. They do not supply a universal acceptance limit for a laboratory method.
- Negative intercepts, residuals, and calculated concentrations remain visible because they can occur mathematically; their laboratory meaning depends on the method and reporting rules.
Methodology
Linear fit and back-calculation
The calculator treats concentration as x and instrument response as y. It fits the standards with an ordinary least-squares straight line, then solves that line for the unknown response. At least three complete standards are required so the residuals can be inspected.
slope = SUM((x - mean_x) * (y - mean_y)) / SUM((x - mean_x)^2)
intercept = mean_y - slope * mean_x
fitted response = slope * concentration + intercept
unknown concentration = (unknown response - intercept) / slope
Fit checks
For each standard, the calculator finds the fitted response and subtracts it from the measured response to produce a signed residual. It reports the largest absolute residual and R-squared, which compares unexplained response variation with total response variation.
residual = measured response - fitted response
R-squared = 1 - SUM(residual^2) / SUM((response - mean_response)^2)
The range status compares the unknown response with the smallest and largest entered standard responses. A response equal to either boundary is interpolation. A response outside either boundary is extrapolation.
Worked mini-example
For standards of 0, 1, 2, and 3 mg/L with responses of 1, 3, 5, and 7, the fitted equation is y = 2x + 1. An unknown response of 4 gives (4 - 1) / 2 = 1.5 mg/L. Because 4 is between the entered responses of 1 and 7, the result is interpolation. Every residual is 0 and R-squared is 1 in this exact straight-line example.