
Choose below, above, between, outside, bottom percent, or top percent to find the matching normal-distribution probability or cutoff.
Advanced options
Table of contents
How to use our Normal Distribution Calculator
- Choose the wording that matches your question: below, above, between, outside, bottom percent, or top percent.
- Choose Raw values for original measurements, or Z-scores only if the problem already gives values in standard deviation units.
- For Raw values, enter the mean and standard deviation in the same unit, then enter the requested value, two bounds, or probability.
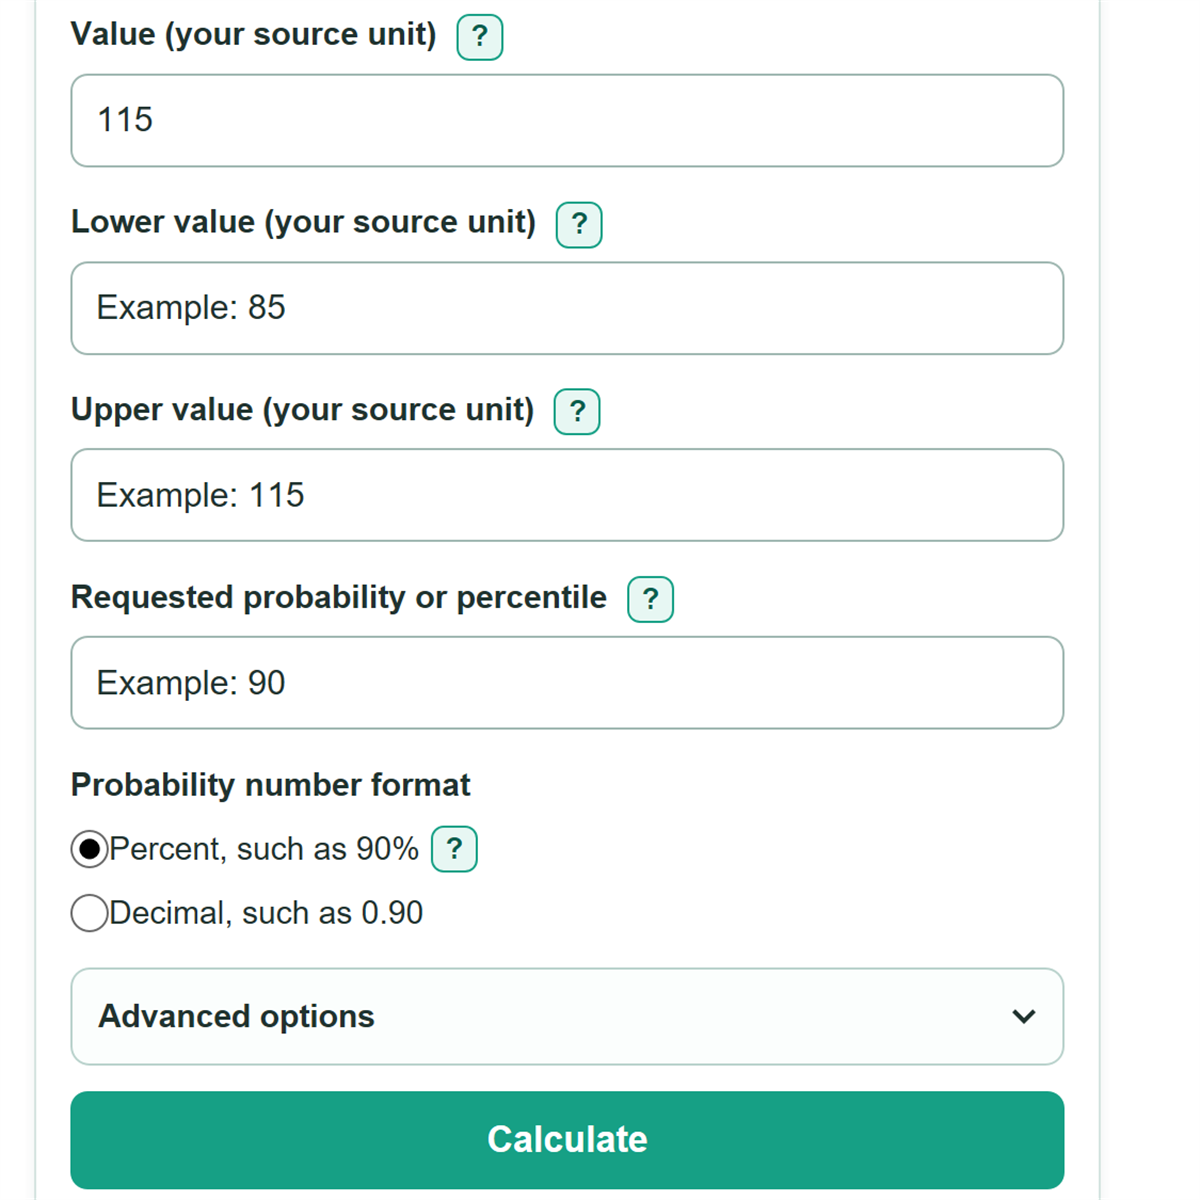
- For a bottom or top percent question, choose whether the probability is written as a percent, such as 90%, or a decimal, such as 0.90.
- Check the probability notation before calculating, then confirm that the answer uses the same curve region named in the question.
Definitions
Normal distribution: A smooth bell-shaped probability model described by a center and a spread. The standard normal distribution has mean 0 and standard deviation 1. [1]
Mean: The center, or average, of the modeled distribution.
Standard deviation: A positive measure of spread. A larger standard deviation makes the curve wider.
Z-score: The number of standard deviations a value is above or below the mean. A positive z-score is above the mean.
Percentile: The percent of values at or below a value. For example, the 84th percentile means about 84% of values are at or below that value.
Cutoff: A boundary value that leaves a selected probability below it or above it.
Outside two values: The combined probability below the lower bound and above the upper bound.
Common mistakes and quick fixes
Mistake: Entering variance where the calculator asks for standard deviation.
Fix: Enter the square root of the variance. Standard deviation must use the same unit as the mean and raw values.
Mistake: Entering a raw score after choosing Z-scores.
Fix: Check What do you want to find? and then recalculate. Choose Raw values, or convert the score to a z-score before entering it.
Mistake: Using "below" when the question asks for a top percent.
Fix: Check What do you want to find? and then recalculate. Choose Probability above a value if you know the cutoff, or Value for a top percent if you need to find the cutoff.
Mistake: Reversing the two bounds.
Fix: Check What do you want to find? and then recalculate. Put the smaller value or z-score in the lower field and the larger one in the upper field.
Mistake: Typing 0.90 while the probability format is Percent.
Fix: Check What do you want to find? and then recalculate. Choose Decimal for 0.90, or keep Percent selected and enter 90.
Mistake: Reading a z-score cutoff as a raw measurement.
Fix: Check What do you want to find? and then recalculate. Check the selected value type and the unit shown with the calculated cutoff.
Limitations & Key Assumptions / Boundary Conditions
- Results describe a normal-distribution model. Real data may be skewed, have more than one peak, or have tails that differ from a normal curve.
- In Raw values mode, the mean, standard deviation, and every entered value must use the same unit. The calculator does not convert units.
- The standard deviation must be greater than 0, and the lower bound must be less than the upper bound.
- Bottom-percent and top-percent cutoffs require a probability strictly between 0% and 100%, or strictly between 0 and 1 when decimal format is selected. The endpoints do not have finite cutoffs.
- The model is continuous, so including or excluding one exact boundary does not change a calculated probability.
- Displayed answers are rounded to the selected number of decimal places. Use more displayed places before using an answer in another calculation.
Methodology
Calculation method
For raw values, each boundary is converted to a z-score, which measures its distance from the mean in standard deviation units. If Z-scores are selected, the entered boundaries are used directly.
z = (x - μ) / σ
In this formula, x is the raw value, μ is the mean, and σ is the standard deviation. The cumulative normal probability, written as Φ(z), is the area at or below z.
Φ(z) = 0.5 * (1 + erf(z / √2))
Below uses Φ(z), and above uses 1 - Φ(z). For two bounds, between subtracts the lower cumulative probability from the upper one. Outside adds the area below the lower bound to the area above the upper bound.
P(a < X < b) = Φ(zb) - Φ(za)
P(X < a or X > b) = Φ(za) + 1 - Φ(zb)
Finding a cutoff
For a bottom percent, the calculator finds the z-score with that probability below it. For a top percent, it first changes the requested right-tail probability into its matching left-tail probability. In Raw values mode, it then converts the z-score back into the source unit.
x = μ + σz
Worked example
With a mean of 100, a standard deviation of 15, and a value of 115, the z-score is (115 - 100) / 15 = 1. The probability below 115 is about 84.1345%, and the probability above 115 is about 15.8655%.