
Calculate estimated detection and quantitation limits from response variation, calibration sensitivity, and the concentration unit in your slope.
Table of contents
How to use our LOD and LOQ from Slope and Blank SD Calculator
- Enter the Response standard deviation in signal units, such as peak area, counts, or absorbance units.
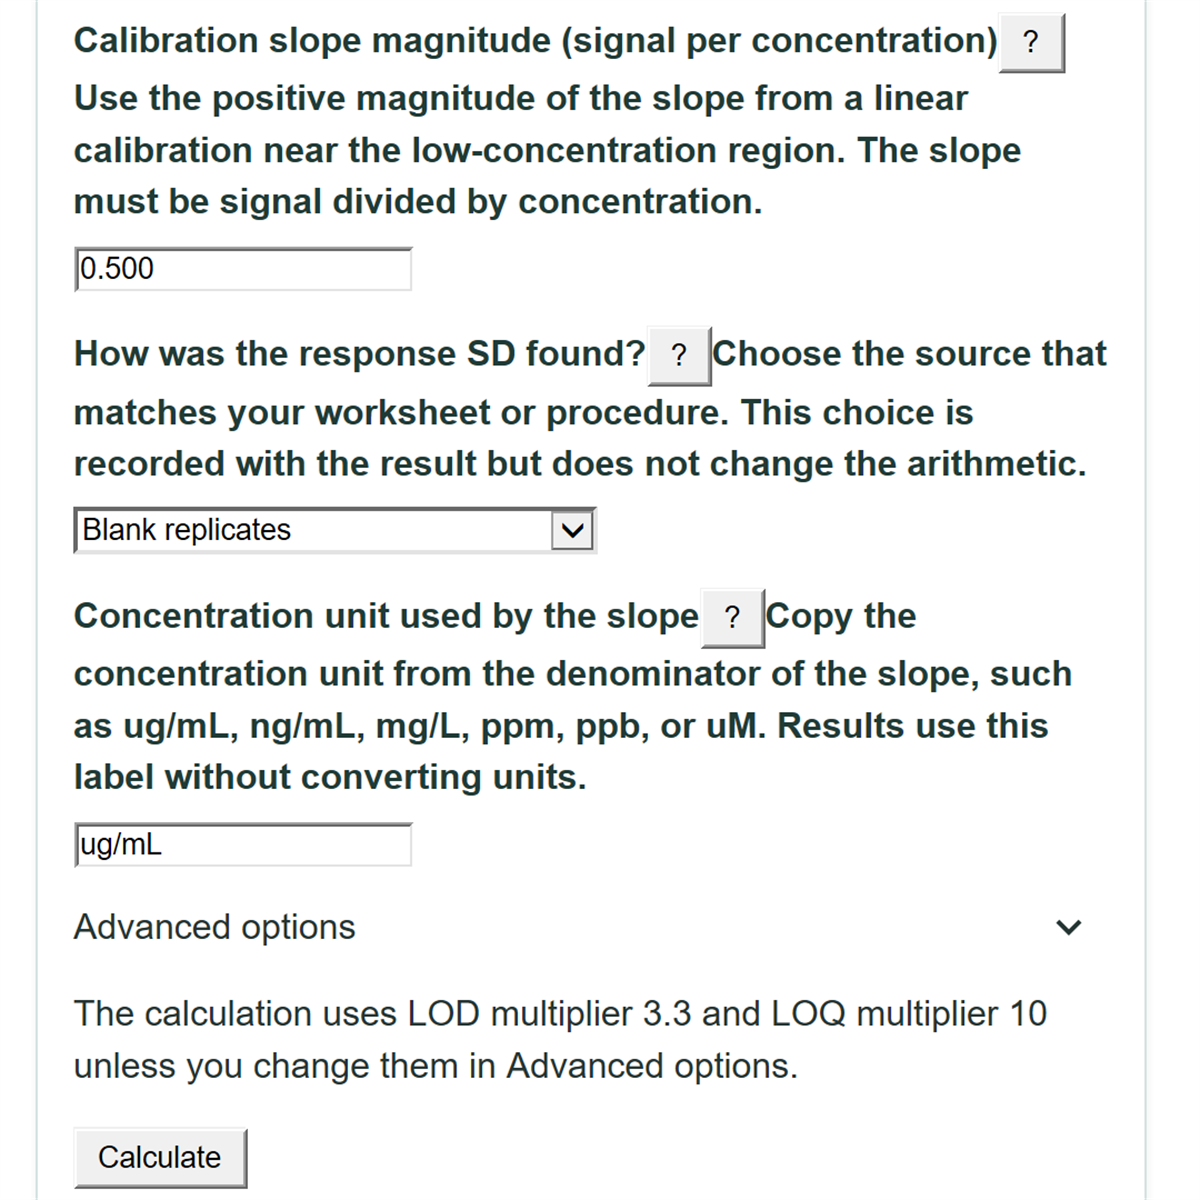
- Enter the positive Calibration slope magnitude as signal per concentration from your linear calibration output.
- Choose How was the response SD found? and enter the Concentration unit used by the slope.
- Use the default multipliers unless your method procedure specifies different values, then select Calculate.
- Sanity-check that the LOQ is higher than the LOD and that both results use the same concentration unit as the slope denominator.
Definitions
Response standard deviation: A measure of how much repeated signal readings vary. In this calculator, it must be in signal units.
Calibration slope magnitude: The positive change in signal for each one-unit change in concentration. Its unit is signal per concentration.
LOD (limit of detection): A preliminary concentration estimate for detecting a signal above variation near zero.
LOQ (limit of quantitation): A preliminary concentration estimate where quantitative performance can be evaluated; it is higher than the LOD in this calculation.
Blank replicates: Repeated measurements of a sample without the analyte of interest, used to estimate response variation.
Regression residuals: The differences between calibration measurements and values predicted by a fitted calibration line.
Y-intercepts from calibration curves: Intercept values from repeated calibration curves; their variation can provide a response-SD basis.
Common mistakes and quick fixes
Mistake: Entering the blank average in Response standard deviation.
Fix: Enter the standard deviation of the blank responses, not their mean.
Mistake: Entering concentration per signal for Calibration slope magnitude.
Fix: Use the positive slope as signal divided by concentration, such as counts per ng/mL.
Mistake: Typing a negative value for Calibration slope magnitude because the regression line slopes downward.
Fix: Enter the positive magnitude requested by the calculator.
Mistake: Choosing Blank replicates under How was the response SD found? when the number came from regression residuals.
Fix: Select the source that matches the worksheet or validation procedure so the calculation record is accurate.
Mistake: Leaving Concentration unit used by the slope blank or entering a unit unrelated to the slope denominator.
Fix: Copy the concentration unit from the slope, such as ug/mL, mg/L, or ng/mL.
Mistake: Treating the Estimated limit of quantitation as a confirmed reporting limit.
Fix: Test samples near the calculated limit using the performance requirements in the applicable procedure.
Limitations & Key Assumptions / Boundary Conditions
- The calculator uses a linear response-SD and slope estimate. It does not test whether the calibration is linear or appropriate near the low-concentration region.
- Results are only as representative as the entered response SD. Blank, matrix, sample preparation, instrument settings, and analyst conditions can change actual performance.
- The concentration unit is a label copied from the slope denominator. No unit conversion or dimensional check is performed.
- Default multipliers are 3.3 for LOD and 10 for LOQ. Use different values only when the applicable method procedure requires them.
- A calculated LOD or LOQ is preliminary. Confirm performance with samples near the estimated limits under the actual method conditions.
- A response SD of zero produces zero estimates mathematically, but zero measured variation may reflect limited data or reporting precision rather than a true zero limit.
Methodology
Calculation
The calculator divides response variation by calibration sensitivity, then applies separate multipliers for detection and quantitation. Response SD is entered in signal units, while the slope is entered as signal per concentration.
Estimated LOD = LOD multiplier x σ (response SD) / S (calibration slope magnitude)
Estimated LOQ = LOQ multiplier x σ (response SD) / S (calibration slope magnitude)
The default LOD multiplier is 3.3 and the default LOQ multiplier is 10. The selected response-SD source is recorded with the result because blank replicates, regression residuals, and y-intercepts describe different calculation bases.
Worked example
If response SD is 0.020 signal units and slope magnitude is 0.500 signal units per ug/mL, the calculation uses 0.020 / 0.500 = 0.040 ug/mL before a multiplier. LOD is 3.3 x 0.040 = 0.132 ug/mL, and LOQ is 10 x 0.040 = 0.400 ug/mL.
Use of the estimates
The formulas provide concentration estimates only when the slope and SD describe the same method conditions and response behavior near the limit. The calculator blocks a negative SD, a zero or negative slope, nonpositive multipliers, and an LOQ multiplier that is not greater than the LOD multiplier. Verify calculated limits with near-limit samples using the applicable procedure.