
Enter spike measurements or a fitted line to estimate unknown concentration from a standard-addition x-intercept.
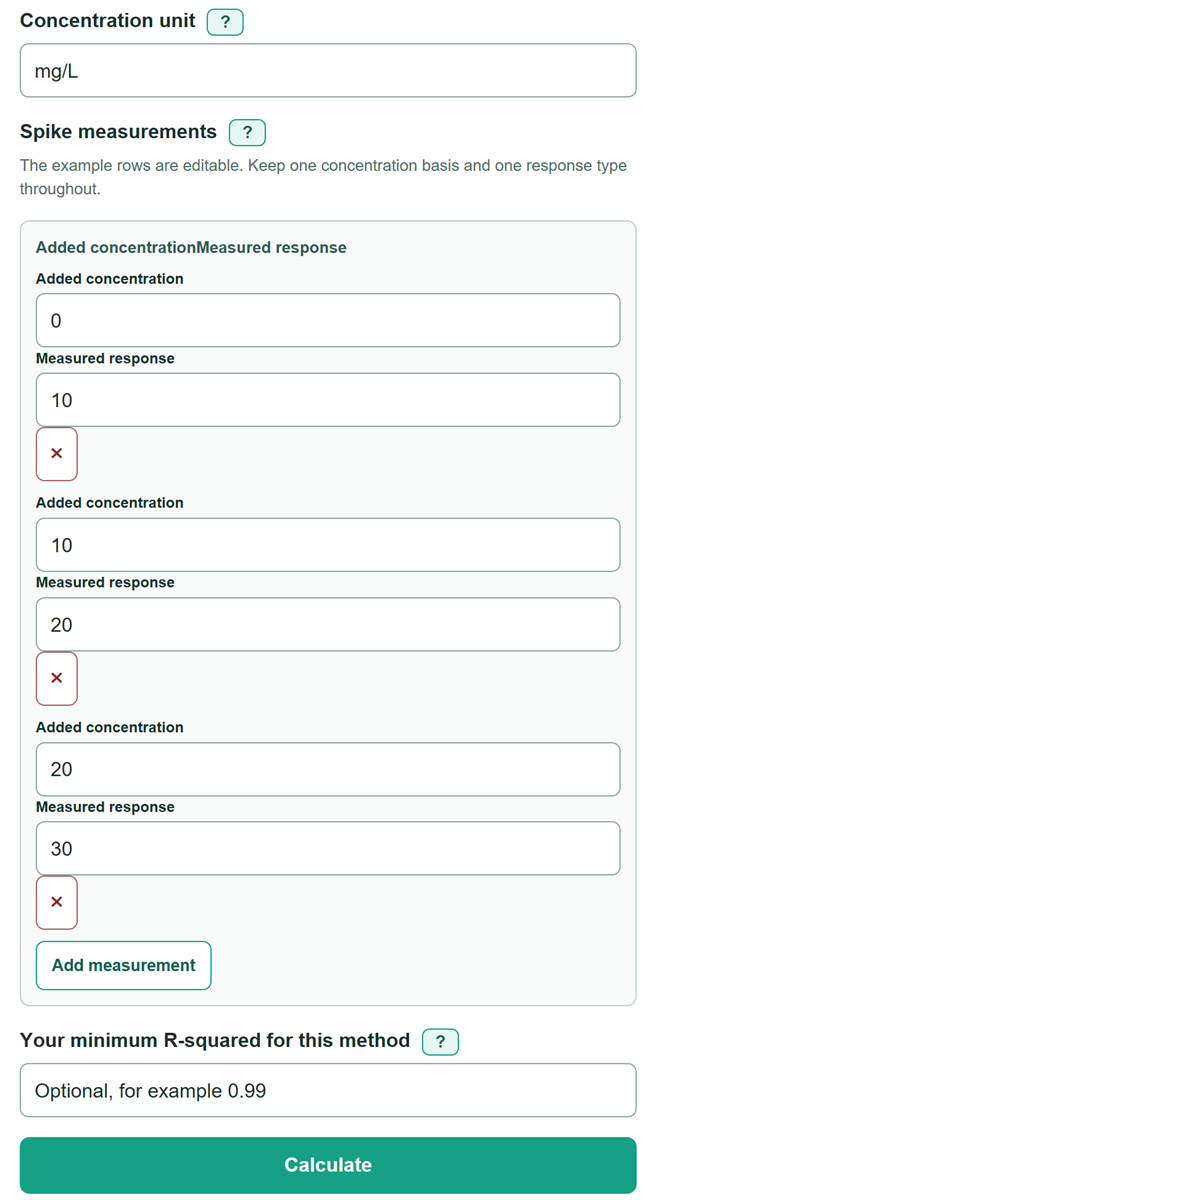
The example rows are editable. Keep one concentration basis and one response type throughout.
Table of contents
How to use our Standard Addition Method Unknown Concentration Calculator
- Choose "Fit spike measurements" to enter paired data, or "Use a fitted line" if you already have regression values.
- Enter a Concentration unit that matches the concentration basis used for every Added concentration value.
- For a spike fit, enter at least three paired Added concentration and Measured response values; use 0 for the unspiked aliquot.
- Click Calculate, then check that the Fitted x-intercept is below 0 and that R-squared from the spike fit and the Largest response miss from the fitted line are reasonable under your method rules.
- Report Estimated unknown concentration on the entered concentration basis, then apply any separate dilution or sample-preparation correction required by your procedure.
Definitions
Standard addition: A calibration approach that adds known analyte amounts to portions of the sample matrix, fits response against added concentration, and uses the negative x-intercept magnitude to estimate the unknown concentration. [1]
Added concentration: The standard-derived analyte concentration added to one final prepared solution. It is the x-axis value.
Measured response: The instrument signal for the matching solution, such as absorbance, peak area, current, or counts. It is the y-axis value.
Fitted slope: The predicted response change for each one-unit increase in added concentration.
Fitted response intercept: The response predicted when added concentration is 0.
Fitted x-intercept: The added-concentration value where the fitted line predicts a response of 0. For this calculation, it must be below 0.
R-squared: The fraction of response variation described by the fitted straight line. A value closer to 1 means the entered points lie closer to that line.
Residual: Measured response minus fitted response for one row. The largest absolute residual is the Largest response miss from the fitted line.
Common mistakes and quick fixes
Mistake: Entering the stock-standard concentration as Added concentration.
Fix: Enter the concentration added to each final prepared solution. Use 0 for the unspiked aliquot.
Mistake: Pairing an Added concentration with the wrong Measured response.
Fix: Keep each row matched to the same prepared aliquot and instrument reading.
Mistake: Mixing mg/L and ug/L while using one Concentration unit label.
Fix: Convert values before entry so every x-axis value uses one concentration basis, then enter that basis as Concentration unit.
Mistake: Treating a negative Fitted x-intercept as a negative sample concentration.
Fix: The calculator uses its positive magnitude as Estimated unknown concentration.
Mistake: Using a Fitted slope and Fitted intercept from different regressions.
Fix: Copy both values from the same standard-addition fit with added concentration on the x-axis and response on the y-axis.
Mistake: Reporting Estimated unknown concentration as the original sample result without checking preparation steps.
Fix: Apply any required aliquot, final-volume, or dilution correction outside this calculator.
Limitations & Key Assumptions / Boundary Conditions
- The calculator assumes a straight-line relationship between Added concentration and Measured response over the entered range.
- Estimated unknown concentration stays on the entered concentration basis. It does not correct for sample aliquot volume, spike volume, final volume, or dilution.
- R-squared and Largest response miss from the fitted line describe the entered line fit. They do not prove accuracy, method validity, blank correction, or control of matrix effects.
- At least three complete paired measurements are required for a spike fit, with at least two different added concentrations and responses that are not all identical.
- The calculation stops if the Fitted x-intercept is 0 or positive because that does not produce a positive unknown concentration under this standard-addition interpretation.
- Use only one response type and one consistent concentration basis within a fit. The calculator labels units but does not convert them.
Methodology
Calculation method
In spike-fit mode, the calculator uses ordinary least-squares regression on each paired Added concentration and Measured response value. The fitted line has the form response = slope times added concentration plus intercept. The unknown concentration is the positive magnitude of the fitted negative x-intercept. This is the standard-addition interpretation described in the GraphPad guide. [1]
fitted_slope = sum((x_i - mean_x) * (y_i - mean_y)) / sum((x_i - mean_x)^2)
fitted_intercept = mean_y - fitted_slope * mean_x
x_intercept = -fitted_intercept / fitted_slope
unknown_concentration = -x_intercept
In these formulas, x_i is one Added concentration, y_i is its matching Measured response, and mean_x and mean_y are their averages. In fitted-line mode, the calculator uses the entered Fitted slope and Fitted intercept directly.
Fit checks
For spike-fit mode, the calculator predicts each response from the fitted line, subtracts that prediction from the entered response, and reports the largest absolute miss.
largest_residual = max(abs(y_i - (fitted_slope * x_i + fitted_intercept)))
It also calculates R-squared from the residuals and total response spread.
r_squared = 1 - sum(residual_i^2) / sum((y_i - mean_y)^2)
Worked example
With Added concentration values of 0, 10, and 20 mg/L and Measured response values of 10, 20, and 30, the fitted slope is 1 response per mg/L and the fitted intercept is 10 response units. The x-intercept is -10 mg/L, so Estimated unknown concentration is 10 mg/L. The line passes through every point, making R-squared 1 and the largest residual 0.
Calculation boundaries
The calculator rejects fewer than three complete rows, negative added concentrations, no spread in x or response values, a zero slope, and a nonnegative x-intercept. It does not calculate an original-sample concentration after dilution or preparation changes, and it does not replace laboratory quality controls, blank evaluation, or method-specific acceptance criteria.