
Calculate fish ADG, SGR, and TGC from two average cohort weights, sampling days, and average water temperature.
Table of contents
How to use our Fish Growth Rate, ADG and Thermal Growth Coefficient Calculator
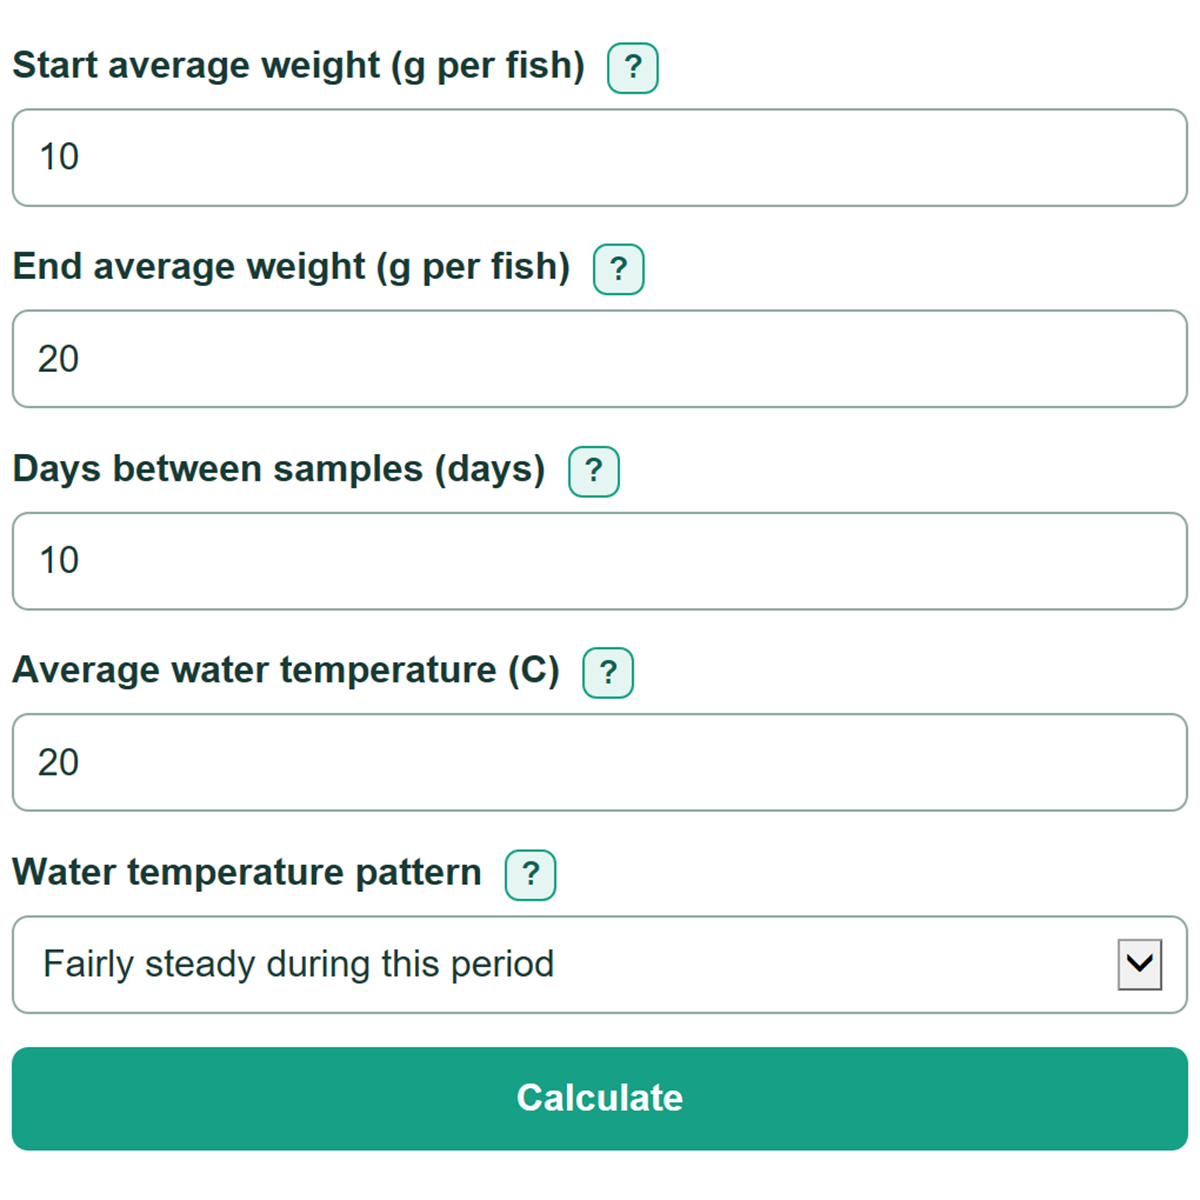
- Enter the representative average fish weight from the first sampling event in Start average weight (g per fish).
- Enter the representative average from the follow-up event in End average weight (g per fish).
- Enter the full Days between samples (days) and the Average water temperature (C) recorded across that same period.
- Choose Water temperature pattern, then select Calculate.
- Check that the direction of ADG, SGR, and TGC matches the weight change: results should be positive when the end average weight is higher and negative when it is lower.
Definitions
Start average weight: The representative average body weight per fish at the first sampling event.
End average weight: The representative average body weight per fish at the follow-up sampling event.
Average Daily Gain (ADG): Average weight change per fish per day, shown in g/fish/day. A negative ADG means the entered average weight decreased.
Specific Growth Rate (SGR): A logarithmic relative growth rate, shown as %/day. It uses the natural logarithm of the end-to-start weight ratio. SGR and TGC are distinct fish-growth indexes with different comparison behavior. [1]
Thermal exposure: Average water temperature multiplied by elapsed days, shown in C-days.
Thermal Growth Coefficient (TGC): A temperature-adjusted growth index based on cube-root weight change per thermal exposure. This calculator uses the common displayed scale factor of 1000. [2]
Common mistakes and quick fixes
Mistake: Entering one fish's weight instead of a representative sample average in Start average weight (g per fish) or End average weight (g per fish).
Fix: Use the average from a representative cohort sample, and use a similar sampling method at both events.
Mistake: Using the number of calendar dates listed instead of the elapsed interval for Days between samples (days).
Fix: Count the full elapsed days from the first sampling event to the follow-up event.
Mistake: Entering a single spot reading in Average water temperature (C).
Fix: Enter the average water temperature across the same days used for the two weight samples.
Mistake: Treating Specific Growth Rate (SGR) as simple percent weight gain.
Fix: Read SGR as a logarithmic relative growth rate in %/day; use Average Daily Gain (ADG) for the simple grams-per-fish-per-day change.
Mistake: Comparing Thermal Growth Coefficient (TGC) as if temperature did not matter after selecting Changed a lot during this period for Water temperature pattern.
Fix: Use the TGC interpretation note and compare TGC cautiously when temperature changed substantially during the sampling interval.
Limitations & Key Assumptions / Boundary Conditions
- Results describe only the cohort represented by the two entered average weights. A biased or inconsistent sample can distort ADG, SGR, and TGC.
- Start average weight, End average weight, Days between samples, and Average water temperature (C) must all describe the same sampling interval.
- TGC uses one average temperature for the interval. When Water temperature pattern is changed a lot during this period, TGC is calculated but is less reliable for comparing groups.
- The calculator does not adjust for mortality, stocking changes, feed intake, fish species, life stage, water quality, disease, or handling stress.
- A lower end weight produces negative ADG, SGR, and TGC. This can be a real cohort weight decrease or a sign to check sampling and record accuracy.
Methodology
Calculation method
The calculator first finds the change in representative average weight. It then uses the same two weights and sampling interval for ADG, SGR, and TGC.
Weight gain = end average weight - start average weight
ADG = weight gain / days between samples
SGR = 100 x ln(end average weight / start average weight) / days between samples
Thermal exposure = average water temperature x days between samples
TGC = 1000 x (√[3]end average weight - √[3]start average weight) / thermal exposure
Worked example
For a cohort increasing from 10 g per fish to 20 g per fish in 10 days at an average 20 C, weight gain is 10 g per fish and thermal exposure is 200 C-days. ADG is 1 g/fish/day, SGR is about 6.9315 %/day, and TGC is about 2.7999.
Calculation scope
Both weights must be greater than 0 because SGR uses a logarithm. Days and average water temperature must be greater than 0 because they are divisors. TGC uses cube-root weights and temperature-days, and its interpretation is best suited to suitable, near-constant temperature conditions. [2]
Sources
- Frontiers | Relationships between the specific growth rate and the thermal-unit growth coefficient applied to cultured juvenile fish - Frontiersin
- tgc: Thermal Growth Coefficient (TGC) in aquacultuR: A Comprehensive R Tool for Zootechnical Metrics - RDRR
- Optimal Feeding Rates for Growth Performance, Nutrient Retention, and Heat Shock Protein 70 Expression in Fingerling Yellow Perch (Perca flavescens) - PMC - NIH