
Calculate buffer capacity from pH readings after an acid or base addition, or predict a simple buffer's local capacity at a chosen pH.
Table of contents
How to use our Buffer Capacity Calculator
- Choose "Measure from a pH change" if you have titration readings, including pH before and after an acid or base addition.
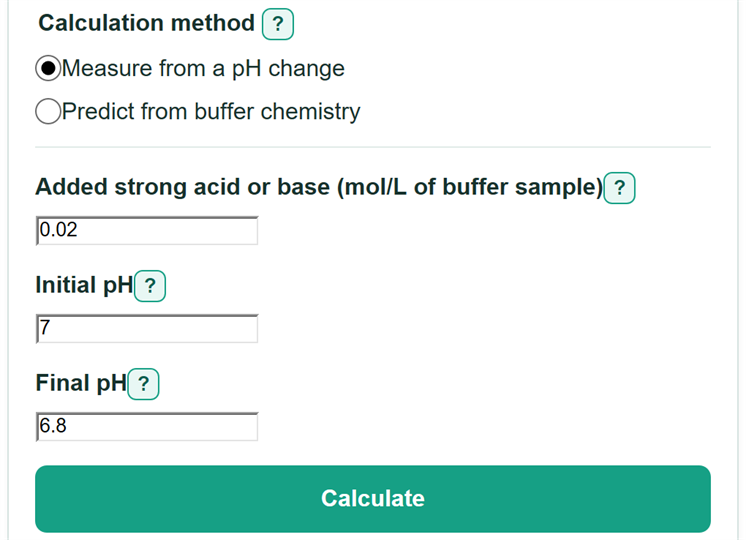
- For the measured method, enter the added strong acid or base in mol/L of buffer sample, plus the initial and final pH readings.
- Choose "Predict from buffer chemistry" if you know the buffer pKa, the combined concentration of HA and A-, and the pH to evaluate.
- Click Calculate. Read the calculation basis: a measured result is an average across a pH interval, while a predicted result is local to one pH.
- Sanity-check the result. A predicted capacity should be closest to its modeled maximum when operating pH is near pKa, and every capacity value is reported in mol/L/pH.
Definitions
Buffer capacity (β): The amount of strong acid or base per liter associated with a one-unit pH change. This calculator reports it in mol/L/pH.
Measured average capacity: Capacity calculated from a known addition and two pH readings. It applies across that finite pH interval.
Local predicted capacity: A model value at one operating pH for a simple weak-acid and conjugate-base buffer pair.
pKa: A number that describes a weak acid's tendency to give up a hydrogen ion. In this model, predicted capacity is greatest when pH equals pKa.
Total buffer concentration: The combined molar concentration of weak acid HA and conjugate base A-, written as [HA] + [A-].
Added strong acid or base: Moles added divided by the original buffer sample volume in liters.
Common mistakes and quick fixes
Mistake: Entering the titrant molarity as the amount added to the buffer.
Fix: Enter moles of strong acid or base added divided by the buffer sample volume in liters. Titrant molarity alone is not enough.
Mistake: Using identical initial and final pH readings.
Fix: Check both recorded readings. A zero pH change makes the measured capacity undefined because the calculation divides by the pH change.
Mistake: Entering Ka in the Buffer pKa field.
Fix: Enter pKa, not Ka. If needed, calculate pKa as -log10(Ka) before using the prediction method.
Mistake: Entering only HA or only A- as total buffer concentration.
Fix: Add both concentrations. Total buffer concentration is [HA] + [A-].
Mistake: Treating a measured average as the capacity at every pH in the interval.
Fix: Use the measured answer only for the entered pH interval. Use the prediction method for a local value at one operating pH.
Mistake: Using the simple prediction after the acid or base buffer component has been used up.
Fix: Do not use the conjugate-pair model once either HA or A- is depleted. Calculate the chemistry for the new solution condition instead.
Limitations & Key Assumptions / Boundary Conditions
- The measured method gives an average over the entered pH interval, not a local capacity at either endpoint.
- The prediction applies to one simple monoprotic weak-acid and conjugate-base pair in an idealized aqueous solution.
- The prediction assumes both HA and A- remain present. It does not apply after a large addition depletes either component.
- The prediction excludes dilution from added titrant, water autoionization, activity corrections, temperature effects on pKa, and interactions among multiple buffer systems.
- Use a pKa that matches the buffer pair and relevant solution conditions. Different temperature or ionic-strength conditions can change the prediction.
- Measured results depend on accurate pH readings, complete mixing, correct sample volume, and correct moles of titrant added.
Methodology
Measured capacity from a pH change
The measured method finds the positive size of the pH change, then divides the added strong acid or base per liter of buffer by that change. It gives an average for the interval between the two pH readings.
|ΔpH| = |pH final - pH initial|
β = c added / |ΔpH|
Here, c added is the molar amount of strong acid or base added per liter of buffer sample. If the two pH readings are equal, the pH change is zero and the expression is undefined.
For example, adding 0.020 mol/L changes pH from 7.00 to 6.80. The absolute pH change is 0.20, so the measured average capacity is 0.020 / 0.20 = 0.100 mol/L/pH.
Local prediction from buffer chemistry
The prediction uses the operating pH, pKa, and total concentration of one weak-acid and conjugate-base pair. It first finds how far the operating pH is from pKa.
r = 10^(-|pH - pKa|)
β = ln(10) × C total × r / (1 + r)^2
C total is [HA] + [A-] in mol/L, and ln(10) is approximately 2.302585. The position factor is largest when operating pH equals pKa.
β maximum = ln(10) × C total / 4
Percent of maximum = 100 × β / β maximum
For pKa 4.76, total concentration 0.100 mol/L, and operating pH 4.76, the predicted local capacity is about 0.0576 mol/L/pH and equals the modeled maximum. At pH 5.76, the same model gives about 0.0190 mol/L/pH, or about 33.1% of that maximum.