
Enter a qPCR standard-curve slope or dilution-series data to calculate amplification efficiency and target multiplication per cycle.
Advanced options
Table of contents
How to use our qPCR Efficiency Calculator
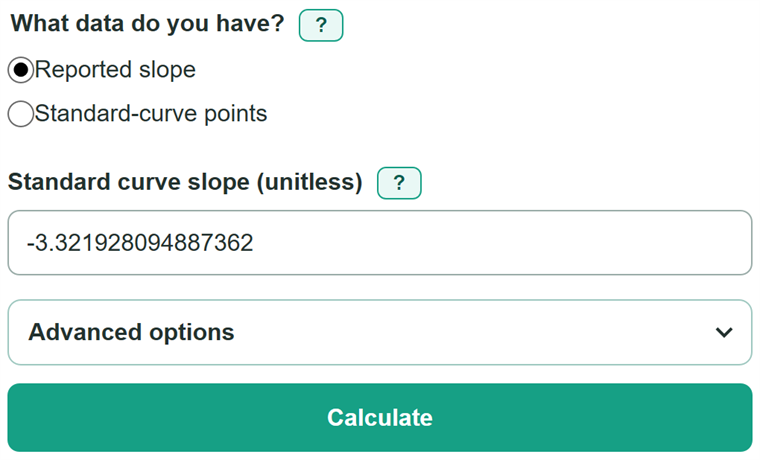
- Choose "Reported slope" if your qPCR software already lists a standard-curve slope, or choose "Standard-curve points" if you have template amounts with matching Ct or Cq readings.
- For a reported slope, enter the negative slope from a graph of Ct or Cq versus log10 template amount. If your report includes R^2, you can enter it under Advanced options.
- For standard-curve points, add at least three complete rows. Each template amount must be greater than 0, and all rows must use the same amount scale, such as 1000, 100, 10, and 1.
- Click Calculate. Read amplification efficiency first; 100% corresponds to an estimated amplification factor of 2 per cycle.
- Sanity-check the result by confirming that the slope is negative. For entered points, inspect R^2 too, then compare the curve with your controls, replicate readings, and laboratory acceptance rules.
Definitions
Ct or Cq: The cycle number where qPCR signal reaches a chosen threshold. Different software may use Ct or Cq for this value.
Standard curve slope: The slope of the fitted line for Ct or Cq versus log10 template amount. This calculator uses the negative-slope convention.
Template amount: The known starting quantity for a standard-curve row. It may be copies, mass, concentration, or a relative dilution amount if every row uses the same scale.
Amplification factor per cycle: The estimated multiplier for target quantity in one cycle. A factor of 2 means estimated doubling per cycle.
Amplification efficiency: The estimated percent increase per cycle calculated from the standard-curve slope. A factor of 2 corresponds to 100% efficiency.
R^2: A value from 0 through 1 that describes how closely the entered points follow the fitted straight line. It measures line fit, not all parts of assay quality.
Common mistakes and quick fixes
Mistake: Entering a positive standard-curve slope.
Fix: Use the slope for Ct or Cq versus log10 template amount. Under this calculator's axis convention, the slope must be negative.
Mistake: Entering 0 as the slope.
Fix: Check the regression report. A zero slope cannot be used because the amplification-factor formula divides by the slope.
Mistake: Mixing copies, mass, concentration, or relative amounts in different rows.
Fix: Use one positive, consistent template-amount scale across every row. Relative dilution values are valid if they stay consistent.
Mistake: Entering zero or a negative template amount.
Fix: Enter an amount greater than 0 for every completed row because log10 is undefined for zero and negative amounts.
Mistake: Treating a high R^2 as proof that an assay is acceptable.
Fix: Use R^2 to check how closely the points fit a line, then review controls, replicate spread, melt behavior when applicable, and laboratory rules.
Mistake: Comparing efficiency percent directly with amplification factor.
Fix: They use different scales. An amplification factor of 2 per cycle corresponds to 100% efficiency.
Limitations & Key Assumptions / Boundary Conditions
- The formulas assume Ct or Cq is plotted against log10 template amount. A reversed axis or a different transformation requires a different formula.
- Template amounts must be positive and use one consistent scale. The calculator cannot determine whether the selected dilution series or units suit a laboratory method.
- Curve mode uses one ordinary least-squares straight line. It does not remove outliers, weight replicate readings, correct baseline settings, or diagnose pipetting errors.
- Efficiency and R^2 are numerical summaries, not a universal pass or fail decision. Review controls, technical replicate spread, melt behavior when applicable, and local assay-validation rules.
- Results depend on the entered slope or data. Rounding Ct or Cq readings before entry can slightly change the fitted slope and efficiency.
Methodology
Calculation
The calculator uses the entered slope in Reported slope mode. In Standard-curve points mode, it fits Ct or Cq as the response against log10 of each positive template amount by ordinary least squares. The fitted slope must be negative for this axis convention.
F = 10^(-1 / m)
F is the amplification factor per cycle, and m is the standard-curve slope.
E = (F - 1) × 100
E is amplification efficiency in percent. The calculator retains the unrounded value during calculation and rounds only the displayed efficiency.
Curve fit
For entered data points, the calculator uses log10(template amount) as the horizontal value and Ct or Cq as the vertical value. It calculates R^2 from the fitted residuals and the variation in Ct or Cq values. R^2 is undefined if all Ct or Cq values are the same.
R^2 = 1 - (sum of squared residuals / sum of squared Ct or Cq deviations from their average)
Mini-example
With a slope of -3.321928, the factor is 10^(-1 / -3.321928), or 2. The efficiency is then (2 - 1) × 100, or 100%. With a slope of -4, the factor is about 1.778 and the efficiency is about 77.8%.
Reading the numbers
A slope near -3.32 gives approximately 100% efficiency under this axis convention. The numerical result should be reviewed with the curve fit and the assay-quality checks used by the laboratory.