
Compare dashboard-range and charge-session observations with your EV’s original ratings. These calculations do not diagnose battery degradation or combine the observations into a state-of-health score.
Table of contents
How to use our Battery Degradation Calculator
- Choose Data to use based on the numbers you have: Range shown by the car, Charge session, or Compare both.
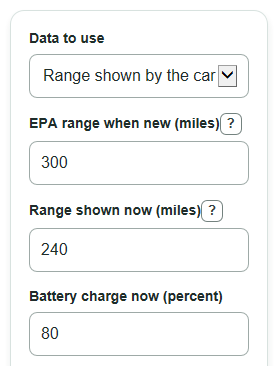
- For the range method, enter EPA range when new, Range shown now, and Battery charge now from the same dashboard moment.
- For the charge method, enter Battery size when new, Energy added in session, Start charge, and End charge from one charging session.
- Click Calculate to see the normalized dashboard range or session-energy extrapolation for the selected mode. Compare both displays these separate observations without averaging them.
- If you use Compare both, check each observation against its own baseline and measurement conditions. Agreement between the numbers does not validate battery health.
Definitions
Battery health (state of health): Remaining usable capacity relative to a matching new baseline under a defined test. This page does not establish it from dashboard range or an uncontrolled charge session.
Battery degradation: Loss of battery performance over time. A change in dashboard range alone does not establish capacity loss.
EPA range when new: The rated driving range the vehicle had when new, used as the baseline for the dashboard-range method.
Range shown now: The miles shown by the car at the current battery charge. It is not always the same as lab-measured range.
Battery charge now: The battery percent shown by the car at the same time as Range shown now.
Battery size when new: The new usable battery capacity in kilowatt-hours, or kWh. A kWh is a unit of energy used for EV batteries [1].
Energy added in session: The energy added during one charge session, in kWh. Battery-side energy is better than wall energy for this calculator.
Comparison: Range and charge-session ratios describe different observations. They are not averaged and have no validated agreement threshold.
Common mistakes and quick fixes
Mistake: Using a trip estimate or old photo for Range shown now while Battery charge now comes from a different time.
Fix: Enter Range shown now and Battery charge now from the same dashboard screen or the same moment.
Mistake: Entering a zero or blank Battery charge now because the car is nearly empty.
Fix: Enter the actual Battery charge now as a percent greater than 0 and at most 100.
Mistake: Using wall power for Energy added in session when the charger number includes charging losses.
Fix: Use energy added to the battery if available, or expect Charge-session estimates to read higher than real battery size.
Mistake: Swapping Start charge and End charge or entering the same percent twice.
Fix: Start charge must be lower than End charge for the charge-session method to work.
Mistake: Mixing gross pack size with usable capacity for Battery size when new.
Fix: Use the usable Battery size when new when you can, so Current usable battery size today compares to the same kind of number.
Mistake: Treating agreement between range and charging observations as proof of battery health. Fix: Use a manufacturer-supported diagnostic or controlled capacity test for a health assessment.
Limitations & Key Assumptions / Boundary Conditions
- This is an estimate from user-entered numbers, not a lab battery test or a vehicle diagnostic scan.
- The dashboard-range method can be skewed by recent speed, temperature, wind, tires, roof racks, road grade, and climate control use.
- The charge-session method can be skewed if Energy added in session is measured at the wall instead of at the battery, because charging has losses.
- EPA range when new and Battery size when new must match the same vehicle and trim. Using the wrong baseline changes every percent result.
- Battery size when new should be usable capacity when possible. Gross pack size can make degradation look larger or smaller than it is.
- Ratios above 100% and negative differences remain visible. They can result from driving conditions, charging losses, state-of-charge calibration or a baseline mismatch; they do not imply battery regeneration or a measured degradation percentage.
- The 5 percentage-point close-match rule is only a practical input-quality check. It is not a manufacturer warranty rule or an industry pass-fail standard.
Methodology
Range shown by the car method
The range method first scales the current dashboard range to a full-battery estimate, then compares that estimate with EPA range when new.
current_full_range_miles = displayed_range_miles / (battery_percent / 100)
range_soh_percent = (current_full_range_miles / epa_range_miles) * 100
miles_lost = epa_range_miles - current_full_range_miles
Charge-session method
The charge method divides session energy by the reported fraction of charge gained. This is an extrapolation, not a measured full capacity. Wall/charger energy includes losses; even battery-side energy needs an accurate, linear state-of-charge interval and matching conditions to support a capacity comparison.
current_capacity_kwh = energy_added_kwh / ((end_charge_percent - start_charge_percent) / 100)
charge_soh_percent = (current_capacity_kwh / original_capacity_kwh) * 100
capacity_loss_kwh = original_capacity_kwh - current_capacity_kwh
Best estimate and agreement check
Each mode keeps its own arithmetic. Range is normalized to 100% displayed charge; session energy is normalized to a 100-percentage-point charge interval. Compare both shows them separately, without producing a battery-health or degradation score.
No combined state-of-health estimate is calculated.
No degradation percentage is inferred from these observations.
soh_gap_percent = abs(range_soh_percent - charge_soh_percent)
No agreement or confidence band is assigned because no validated tolerance for these two observations is established.
Mini-example
If EPA range when new is 300 miles, Range shown now is 216 miles and Battery charge now is 80%, normalized range is 270 miles, or 90% of the EPA baseline. The difference is 30 miles; this is not proof of 10% battery degradation.
With a 75 kWh original rating, 26.25 kWh session energy and charge rising from 20% to 60%, extrapolated session energy is 65.625 kWh, or 87.5% of the rating. Its interpretation depends on measurement boundary, losses and state-of-charge accuracy.
Compare both would display the 90% range ratio and 87.5% session-energy ratio separately. Neither their average nor the difference establishes battery health.
Sources
- Alternative Fuels Data Center: Batteries for Electric Vehicles - Energy
- [2408.01127] Relax, Estimate, and Track: a Simple Battery State-of-charge and State-of-health Estimation Method - Arxiv
- [2502.19586] Battery State of Health Estimation and Incremental Capacity Analysis under Dynamic Charging Profile Using Neural Networks - Arxiv