
Compare dollar cost averaging with lump sum investing after expected growth, fees, and spread or slippage costs.
Table of contents
How to use our Dollar Cost Averaging Calculator
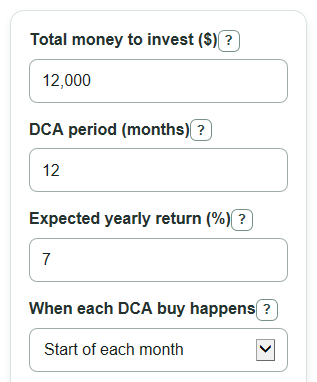
- Enter the Total money to invest as the full budget you want to compare.
- Enter the DCA period and Expected yearly return, then choose When each DCA buy happens.
- Open Advanced options if you want to include Fee for each buy or Spread or slippage cost.
- Click Calculate and read Cost-adjusted lump sum lead first; a positive number favors lump sum, and a negative number favors DCA.
- Sanity-check the output by comparing Each DCA buy after costs with your planned monthly buy. If costs take a large share of each buy, the comparison may be driven more by fees than by return.
Definitions
Dollar cost averaging (DCA): Investing a set amount over time instead of putting all the money in at once [1].
Lump sum: Investing the full Total money to invest right away in one buy.
Expected yearly return: The yearly growth rate you choose for the estimate. It is an input assumption, not a prediction.
Monthly growth rate: The steady monthly rate that compounds to the Expected yearly return over 12 months.
Fee for each buy: A flat cost charged on each purchase. DCA pays it once per monthly buy, while lump sum pays it once.
Spread or slippage cost: A percent cost used for the difference between the displayed price and the price you actually get.
Cost-adjusted lump sum lead: Lump sum ending value after costs minus DCA ending value after costs. Negative means DCA ends higher.
Common mistakes and quick fixes
Mistake: Entering a per-month amount in Total money to invest instead of the full budget.
Fix: Put the full amount you plan to invest across the whole DCA period in Total money to invest.
Mistake: Treating Expected yearly return as a guaranteed market return.
Fix: Use Expected yearly return as a test assumption and try lower or negative values to see how the gap changes.
Mistake: Putting a yearly fee in Fee for each buy.
Fix: Enter only the flat cost charged on each purchase in Fee for each buy.
Mistake: Entering Spread or slippage cost as 1.00 for 100% instead of 1%.
Fix: If the estimated cost is one percent of each buy, enter 1 in Spread or slippage cost.
Mistake: Reading Cost-adjusted lump sum lead as always good when it is positive.
Fix: Positive means lump sum ends higher in this steady-return estimate, but it does not measure the risk of investing all at once before a market drop.
Limitations & Key Assumptions / Boundary Conditions
- The calculator uses a steady Expected yearly return converted into a steady monthly growth rate. Real markets move up and down.
- It does not use live prices, historical prices, dividends, taxes, bid-ask spread data, or reinvestment rules.
- Fee for each buy is treated as a flat dollar cost. Spread or slippage cost is treated as the same percent on every buy.
- DCA buys are monthly only. The DCA period must be a whole number of months from 1 to 600.
- Lump sum is treated as invested immediately for the full DCA period. DCA timing depends on the selected start-of-month or end-of-month choice.
- If buying costs make Each DCA buy after costs or the lump sum invested amount negative, the calculation is not meaningful and should be corrected.
- The comparison shows ending value under the entered assumptions. It does not measure emotional comfort, short-term risk, or the chance of a market drop right after investing.
Methodology
How the return is converted
The calculator first turns Expected yearly return into a steady monthly growth rate. This uses compound growth, where growth is earned on earlier growth [2].
monthly_rate = (1 + expected_annual_return_percent / 100)^(1 / 12) - 1
How costs are applied
The Total money to invest is treated as the whole budget. For DCA, that budget is split evenly across the DCA period. Each buy loses the entered percent cost and the flat Fee for each buy before money is invested.
contribution = total_money / dca_months
dca_buy_after_costs = contribution * (1 - spread_slippage_percent / 100) - fee_per_buy
lump_buy_after_costs = total_money * (1 - spread_slippage_percent / 100) - fee_per_buy
Buying costs are also shown separately so you can see how much of the budget did not get invested.
dca_buying_costs = dca_months * (fee_per_buy + contribution * spread_slippage_percent / 100)
lump_sum_buying_costs = fee_per_buy + total_money * spread_slippage_percent / 100
How ending values are found
If the monthly growth rate is not zero, DCA uses the future value of equal monthly buys. End-of-month timing gives each buy growth only after it is made. Start-of-month timing gives each buy one extra month of growth.
dca_end_timing_value = dca_buy_after_costs * (((1 + monthly_rate)^dca_months - 1) / monthly_rate)
dca_start_timing_value = dca_end_timing_value * (1 + monthly_rate)
if monthly_rate = 0, dca_ending_value = dca_buy_after_costs * dca_months
The lump sum amount is invested after one set of buying costs and grows for the full DCA period.
lump_sum_ending_value = lump_buy_after_costs * (1 + monthly_rate)^dca_months
How the lead is reported
The main comparison subtracts the DCA ending value from the lump sum ending value.
strategy_gap_after_costs = lump_sum_ending_value - dca_ending_value
A positive Cost-adjusted lump sum lead means lump sum ends higher. A negative value means DCA ends higher. If the gap rounds to $0.00, the strategies are shown as about tied.
Worked mini-example
Suppose Total money to invest is $12,000, the DCA period is 12 months, Expected yearly return is 0%, Fee for each buy is $5, and Spread or slippage cost is 0%. Each DCA contribution is $1,000, so Each DCA buy after costs is $995. DCA buying costs are 12 * $5, or $60, and DCA ending value after costs is $11,940. Lump sum buying costs are $5, so Lump sum ending value after costs is $11,995. The Cost-adjusted lump sum lead is $55.