
Compare paying debt faster with investing the same extra money over a clear month-by-month timeline.
Advanced options
Table of contents
How to use our Pay Off Debt or Invest Calculator
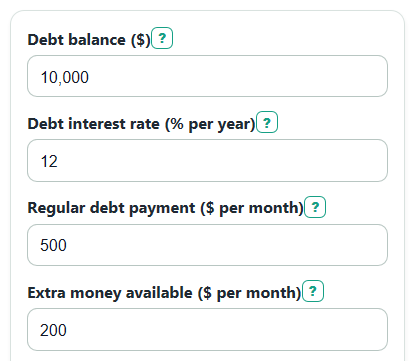
- Enter your Debt balance ($), Debt interest rate (% per year), and Regular debt payment ($ per month).
- Enter the Extra money available ($ per month) and Expected investment growth (% per year) you want to compare.
- Open Advanced options only if you want to change Time to compare (months), Yearly tax drag on investment growth (%), or Extra match on money invested (%).
- Select Calculate and read Better path first, then check How much one path is ahead and both payoff times.
- Sanity-check the result: if the debt rate is high and the expected investment growth is low, debt payoff should usually look stronger; if not, review your inputs.
Definitions
Debt balance ($): The amount still owed on the debt at the start of the comparison.
Debt interest rate (% per year): The yearly debt rate, often called APR. Paying down debt avoids future interest on the balance.
Regular debt payment ($ per month): The monthly payment you already plan to make before using extra money.
Extra money available ($ per month): The added monthly cash tested in both paths, either as extra debt payment or as investment money.
Expected investment growth (% per year): The steady yearly growth rate used in the model. Real investment returns are not guaranteed.
Yearly tax drag on investment growth (%): A yearly reduction for taxes or fees. It lowers the growth rate used for the investment path.
Extra match on money invested (%): Extra money added to each invested dollar, such as an employer match.
Investment growth needed to tie: The yearly growth rate that makes the debt-first and invest-first ending values equal in this model.
Common mistakes and quick fixes
Mistake: Entering the minimum payment instead of your planned Regular debt payment ($ per month).
Fix: Use the payment you actually expect to make each month before adding Extra money available ($ per month).
Mistake: Typing a monthly rate in Debt interest rate (% per year).
Fix: Enter the yearly APR, such as 12 for 12% per year.
Mistake: Treating Expected investment growth (% per year) as guaranteed.
Fix: Use a realistic estimate and compare it with Investment growth needed to tie, because real investments can lose money.
Mistake: Leaving Time to compare (months) too short for your real plan.
Fix: Set Time to compare (months) to the number of months you care about, up to 600.
Mistake: Forgetting taxes or fees when reading Debt-first ending value and Invest-first ending value.
Fix: Add Yearly tax drag on investment growth (%) if taxes or fees reduce the investment growth you keep.
Mistake: Reading How much one path is ahead without checking the sign.
Fix: A positive How much one path is ahead means invest first is ahead; a negative value means debt first is ahead.
Limitations & Key Assumptions / Boundary Conditions
- The calculator uses steady monthly investment growth. Real investments can rise, fall, or have uneven returns.
- Debt interest is added before each monthly payment. A lender may calculate daily interest or use a different payment posting date.
- The model treats the investment match as immediate on every invested dollar. It does not apply employer plan limits, vesting rules, annual caps, or eligibility rules.
- Yearly tax drag on investment growth (%) is a simple reduction to the yearly growth rate. It does not model tax brackets, capital gains timing, account type, or deductions.
- If the Regular debt payment ($ per month) is too low to cover interest, the balance can grow. The calculator still shows the ending value and payoff time status.
- The comparison does not include emergency savings needs, credit score effects, loan fees, prepayment penalties, inflation, or changes in your income.
- Time to compare (months) is capped at 600 months to keep the month-by-month calculation practical and readable.
Methodology
How the comparison is built
The calculator runs two month-by-month paths using the same starting debt and the same monthly cash flow. In the debt-first path, Regular debt payment ($ per month) plus Extra money available ($ per month) goes to the debt until it is gone, then that full amount is invested. In the invest-first path, the regular payment goes to debt while the extra money is invested from the start; after the debt is gone, the full monthly amount is invested.
Debt update each month
Interest is added to the debt balance, then the planned payment is applied. The last payment can be smaller than the planned payment, and unused payment money is invested at the end of that month. Loan interest is generally based on a percentage of the amount owed [3].
interest_m = balance_start_m * (debt_apr / 100 / 12)
balance_before_payment_m = balance_start_m + interest_m
payment_m = min(planned_payment_m, balance_before_payment_m)
balance_end_m = balance_before_payment_m - payment_m
Investment update each month
The yearly expected growth is reduced by any Yearly tax drag on investment growth (%), then converted to a steady monthly growth rate. Investing can involve growth, income, and compounding, but actual returns are uncertain [1].
monthly_invest_rate = (1 + ((expected_return - investment_tax_drag) / 100))^(1 / 12) - 1
investment_end_m = investment_start_m * (1 + monthly_invest_rate) + cash_invested_m * (1 + match_percent / 100)
Ending values and gap
At the end of Time to compare (months), each path is measured as investment balance minus any debt still left. The gap keeps its sign so you can see which side is ahead.
debt_first_net_worth = debt_first_investment_balance - debt_first_remaining_debt
invest_first_net_worth = invest_first_investment_balance - invest_first_remaining_debt
net_worth_gap = invest_first_net_worth - debt_first_net_worth
Break-even return
The calculator searches for the Expected investment growth (% per year) that makes the net worth gap equal to zero, while keeping the same debt inputs, time, tax drag, and match settings. It uses bisection, which means it tests a return range, keeps the half that contains the tie point, and repeats until the answer is close enough. If the tie point is outside the tested range, it shows a short range message instead of a fake exact rate.
target: net_worth_gap = 0
Mini-example
Suppose Debt balance ($) is 12000, Debt interest rate (% per year) is 0, Regular debt payment ($ per month) is 300, Extra money available ($ per month) is 300, Expected investment growth (% per year) is 0, and Time to compare (months) is 60. Debt first pays off in 20 months, then invests 600 per month for 40 months, for an ending value of 24000. Invest first pays 300 to debt and invests 300 per month for 40 months, then invests 600 per month for 20 months, also ending at 24000. With no debt interest, no investment growth, no tax drag, and no match, the two paths tie because the total cash flow is the same.