
Use this dihybrid cross calculator to build a 4×4 Punnett square, list each parent's gametes, and find genotype and phenotype chances.
Advanced options
How to use our Dihybrid Cross Calculator - Punnett Square
- Pick the genotype for each parent in Parent 1, gene 1 genotype, Parent 1, gene 2 genotype, Parent 2, gene 1 genotype, and Parent 2, gene 2 genotype.
- Choose Show results as if you want both views, only exact letter combinations, or only visible traits.
- If you want easier-to-read trait labels, open Advanced options and fill in Gene 1 dominant trait name, Gene 1 recessive trait name, Gene 2 dominant trait name, and Gene 2 recessive trait name.
- Click Calculate to see the 4x4 Punnett square, Parent 1 gametes, Parent 2 gametes, Genotype counts, Phenotype ratio, and Phenotype probabilities.
- Sanity-check the answer by comparing the gametes to the rows and columns of the square, then make sure the grouped boxes add up to 16 total outcomes.
Definitions
Genotype: The allele letters for a gene, such as AA, Aa, or aa.
Phenotype: The visible trait group caused by a genotype, such as a dominant-looking trait or a recessive-looking trait.
Dominant: A trait rule where one uppercase allele is enough to show that trait for a gene.
Recessive: A trait rule where the visible trait appears only when both alleles are lowercase for that gene.
Gamete: A sex cell that carries one allele from each gene. In this calculator, gametes make the row and column labels of the Punnett square.
4x4 Punnett square: A grid with 16 boxes that shows all offspring combinations for a two-gene cross when each parent can make four gametes [1].
Phenotype ratio: The count pattern of visible trait groups, written like 9:3:3:1 when that pattern applies.
Common mistakes and quick fixes
Mistake: Mixing the two genes in one field, such as trying to treat Parent 1, gene 1 genotype like it should hold both genes.
Fix: Enter only the first gene in Parent 1, gene 1 genotype and only the second gene in Parent 1, gene 2 genotype .
Mistake: Expecting Parent 1 gametes or Parent 2 gametes to always show four different gametes.
Fix: If a parent is homozygous for a gene, some gametes repeat, so fewer unique gametes is correct.
Mistake: Reading Genotype counts as if they were visible traits.
Fix: Use Genotype counts for exact letter combinations and use Phenotype ratio or Phenotype probabilities for visible trait groups.
Mistake: Leaving trait labels blank and then getting confused by phenotype names.
Fix: Fill in Gene 1 dominant trait name , Gene 1 recessive trait name , Gene 2 dominant trait name , and Gene 2 recessive trait name if you want phenotype results to match your class example.
Mistake: Thinking the Phenotype ratio must always be 9:3:3:1.
Fix: That classic ratio happens for AaBb x AaBb under the tool's assumptions, but other valid parent genotype choices can give different ratios.
Mistake: Forgetting to match Show results as to the homework question.
Fix: Choose genotype view when you need allele letters in each box, phenotype view when you need visible traits, or both when you need the full breakdown.
Limitations & Key Assumptions / Boundary Conditions
- This calculator models only two genes at a time.
- It assumes simple Mendelian inheritance with complete dominance for each gene.
- It assumes the two genes assort independently, so it does not model linked genes.
- It does not model incomplete dominance, codominance, sex linkage, mutation, or unequal survival of offspring.
- Trait-name fields change only the wording of phenotype labels, not the math.
- Some parent genotype pairs produce fewer than four unique gametes, so the main counts may repeat outcomes rather than show four different gamete types.
Methodology
How the calculator works
The calculator first finds the gametes each parent can make by taking one allele from gene 1 and one allele from gene 2. A homozygous gene contributes one possible allele, while a heterozygous gene contributes two.
g = n1 * n2
Here, g is the number of distinct gamete types from one parent, and each n is 1 for a homozygous gene or 2 for a heterozygous gene.
Next, it combines every parent 1 gamete with every parent 2 gamete to fill the offspring grid.
cells = g1 * g2
For the classic AaBb x AaBb cross, each parent makes 4 gamete types, so the square has 16 boxes [1].
Each offspring box is then sorted two ways: by exact genotype and by phenotype group. For phenotype grouping, the calculator uses complete dominance for each gene.
dominant phenotype if genotype has at least one uppercase allele
recessive phenotype only if genotype is lowercase-lowercase
After counting matching boxes, the calculator turns each count into a probability.
P(category) = count(category) / total_cells
When the two genes assort independently, you can also cross-check a combined phenotype by multiplying the separate gene probabilities.
P(A and B) = P(A) * P(B)
Mini-example
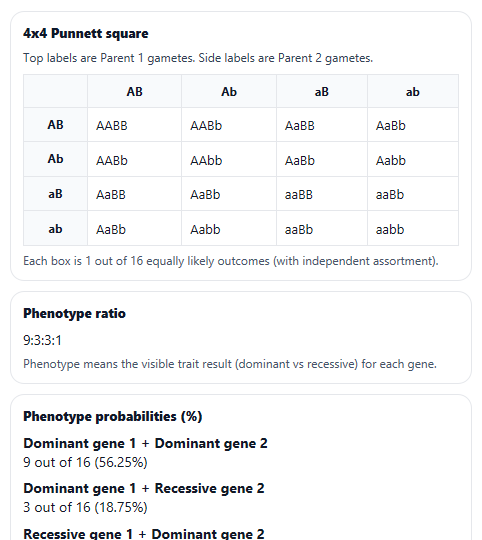
Suppose both parents are AaBb. Each parent can make AB, Ab, aB, and ab gametes. That gives 16 total offspring boxes. If you group the boxes by phenotype, 9 show both dominant traits, 3 show dominant gene 1 with recessive gene 2, 3 show recessive gene 1 with dominant gene 2, and 1 shows both recessive traits, giving the well-known 9:3:3:1 ratio under these assumptions [1].
How to read the output
4x4 Punnett square is the full set of possible offspring combinations. Genotype counts tell you how many boxes match each exact letter pattern. Phenotype probabilities tell you the percent chance of each visible trait combination. If one phenotype group gets all 16 boxes, the calculator shows 100% for that group.
Assumptions used
The results match a basic classroom dihybrid model: two genes, complete dominance, and independent assortment. Real inheritance can differ if genes are linked or if the trait does not follow simple dominant versus recessive behavior.