
Enter AA, Aa, and aa genotype counts to find the observed frequencies of allele A and allele a in your sample.
Table of contents
How to use our Allele Frequency Calculator
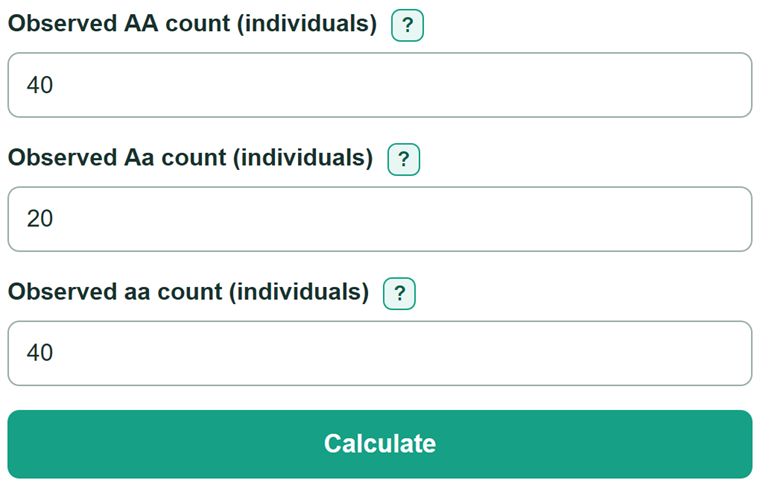
- Enter the number of sampled individuals with genotypes AA, Aa, and aa. Enter 0 if a genotype was not observed.
- Click Calculate to see allele A frequency, p, and allele a frequency, q, as decimal proportions and percentages.
- Sanity-check the first result: p plus q should equal 1.0000, or 100%, for complete counts at a two-allele location.
- Read the sample size and allele-copy total to confirm they match your genotype table. Each diploid individual contributes two allele copies.
- Compare the observed counts with the Hardy-Weinberg expected frequencies and counts, remembering that expected values are model predictions.
Definitions
Allele: A version of a gene at one genetic location. This calculator calls the two alleles A and a.
Genotype: The pair of alleles at that location in one diploid individual: AA, Aa, or aa.
Allele frequency: The share of all counted allele copies that are one allele. p is the frequency of A, and q is the frequency of a.
Diploid: Having two copies at the genetic location being counted, so each individual contributes two allele copies.
Hardy-Weinberg expectation: A model-based genotype frequency calculated as p squared, 2pq, or q squared from allele frequencies. It is not an observed genotype share. [1]
Common mistakes and quick fixes
Mistake: Entering allele-copy totals instead of numbers of individuals with AA, Aa, and aa.
Fix: Enter genotype counts of individuals. The calculator assigns two allele copies to each individual.
Mistake: Counting each Aa individual as two A copies or two a copies.
Fix: Each Aa individual contributes one A copy and one a copy.
Mistake: Leaving all three genotype counts at 0.
Fix: Enter at least one individual across the three fields. An empty sample has no allele frequency.
Mistake: Entering a negative number or decimal count.
Fix: Use nonnegative whole numbers because the fields count individuals.
Mistake: Treating p squared, 2pq, and q squared as observed genotype frequencies.
Fix: Use AA, Aa, and aa counts as the observations. The p squared, 2pq, and q squared values are Hardy-Weinberg expectations.
Limitations & Key Assumptions / Boundary Conditions
- This calculator requires complete AA, Aa, and aa genotype counts for diploid individuals at one location with only two alleles.
- Observed p and q come directly from the entered counts and do not require Hardy-Weinberg equilibrium.
- Hardy-Weinberg expected values assume random mating, no selection, mutation, or migration, and a very large population. [1]
- Expected genotype counts can be decimals because they are model predictions, not literal counts of individuals.
- Missing genotype data, genotyping errors, additional alleles, or a different number of chromosome copies can make the calculation unsuitable.
Methodology
Observed allele counting
The calculator adds the AA, Aa, and aa counts to find the sample size. An AA individual contributes two A copies, an Aa individual contributes one A and one a copy, and an aa individual contributes two a copies. Dividing each allele-copy total by all allele copies gives the observed frequencies. [2]
N = AA + Aa + aa
total allele copies = 2N
p = (2AA + Aa) / (2N)
q = (2aa + Aa) / (2N)
For complete counts with only A and a, p + q = 1.
Hardy-Weinberg comparison
The calculator uses the observed p and q values to calculate model-based expected genotype frequencies. Under Hardy-Weinberg conditions, the expected frequencies are p squared for AA, 2pq for Aa, and q squared for aa. [1]
expected AA frequency = p^2
expected Aa frequency = 2pq
expected aa frequency = q^2
expected genotype count = expected frequency * N
Worked example
For AA = 30, Aa = 50, and aa = 20, the sample size is 100 and there are 200 allele copies. p = (2 x 30 + 50) / 200 = 0.55, and q = 0.45. The Hardy-Weinberg expected counts are 30.25 AA, 49.5 Aa, and 20.25 aa.